Page 4 of 16
CM16.3 | CM16.3 | Health Management Techniques — SDL Guide
Learning Objectives
- Describe planning and scheduling management techniques including Gantt charts, PERT/CPM, and the logical framework
- Distinguish between cost-effectiveness, cost-benefit, and cost-utility analyses in health programme decision-making
- Explain quality improvement techniques including TQM and the PDSA cycle
- Apply appropriate management techniques to common health programme management challenges
INSTRUCTIONS
A health programme without effective management is a budget line without impact. This module covers the practical tools that health managers use to schedule activities, make economic decisions, improve quality, and supervise implementation — the management layer that determines whether well-designed health plans actually deliver results. These techniques are directly relevant to your future role as a district medical officer, public health practitioner, or programme manager.
References
- Park K. Park's Textbook of Preventive and Social Medicine, 27th ed. Ch: Health Management and Administration (textbook)
- Gulati N. Public Health Administration and Management. Ch: Management Techniques in Health (textbook)
- Government of India. NHM Programme Implementation Plans. MoHFW, 2013 onward (policy)
Version 2.0 | NMC CBUC 2024
CLINICAL SCENARIO
A district maternal health programme had a clear plan: train 200 auxiliary nurse midwives (ANMs) in skilled birth attendance, procure delivery kits for all sub-centres, and achieve 80% institutional delivery coverage within 18 months. Two years later, a review found: training was completed for only 110 ANMs (delayed by poor scheduling), 40% of delivery kits had expired in a warehouse (no distribution plan), and institutional delivery was at 61% (no mid-course monitoring or correction). The plan was sound; the management was not. The techniques that would have prevented each of these failures — a Gantt chart for training scheduling, a supply chain management plan, and an HMIS-based monitoring dashboard — are exactly what this module covers.
WHY THIS MATTERS
As a future medical officer in charge of a primary health centre, you will be both a clinician and a manager. You will need to manage a budget, supervise ANMs and health workers, submit HMIS reports, conduct quality checks, and justify resource requests to the block health officer. Understanding management techniques is not an administrative abstraction — it is the practical toolkit that determines whether your facility's antenatal coverage improves or stagnates, whether your drug stock expires or is used rationally, and whether your patients receive consistent quality care.
RECALL
From the previous SDL in this cluster, recall the six-phase planning cycle: situation analysis → priority setting → plan formulation → implementation → monitoring and evaluation → re-planning. The management techniques in this module operationalise particularly Phase 4 (implementation) — Gantt charts and PERT/CPM schedule and coordinate activities; task shifting deploys the human resource — and Phase 5 (M&E) — HMIS dashboards, supervision frameworks, and TQM/PDSA ensure quality is tracked and improved. Also recall from earlier Community Medicine: the levels of health care (sub-centre, PHC, CHC, district hospital) form the organisational context within which these management techniques are applied.
The Burden of Management Failure in Health Programmes
Poor health management imposes a very concrete burden — not just on institutions, but on patients who do not receive the care they need. The burden of management failure manifests in multiple ways across India's health system, and documenting it is the first step toward understanding why management techniques matter.
Drug stockouts are among the most visible manifestations. A 2019-20 study across 30 districts in five Indian states found that 28% of PHCs had experienced at least one essential drug stockout lasting more than two weeks in the previous quarter — not because drugs were unavailable in the state, but because indent timing, storage capacity assessment, and supply chain tracking were poorly managed. Patients turned away from PHCs with preventable conditions represent a direct health cost of management failure.
Resource wastage compounds the problem. India's Health Management Information System data consistently shows underutilisation of sanctioned posts — in some states, 15-30% of sanctioned specialist posts at CHCs remain vacant for years, not due to the absence of trained doctors nationally, but due to failures in deployment, posting management, and incentive structures. Similarly, equipment procured without maintenance planning becomes non-functional within 2-3 years of installation — an operational management failure that wastes capital investment.
Programme duplication and poor coordination between vertical programmes (TB, malaria, MCH, NCD) drain shared resources. When each programme runs its own outreach camps without coordinating with others, the community health worker is sent to the same village by three different programme officers in the same week — and none of the week's visits are used optimally. Integration management — using tools like the logframe to map shared outputs — reduces this waste.
The common thread across these failures is not a lack of resources or plans; it is a lack of systematic management technique application. A district health team equipped with the tools covered in this module can track, prevent, and correct each of these failure modes.
Determinants of Effective Health Management
Choosing the right management technique requires understanding the context in which it will be applied. Not every tool is appropriate in every setting, and imposing a complex management framework on a resource-constrained district PHC will fail not because the technique is wrong in principle, but because the contextual determinants were not considered.
The resource and infrastructure determinants are foundational: a Gantt chart requires staff who can interpret it; a digital HMIS dashboard requires reliable internet connectivity; cost-utility analysis requires quality-of-life measurement data that may simply not exist for a given Indian setting. The management technique must be feasible within the actual resource envelope, not the ideal one.
The workforce skill mix determinant shapes which tasks can be delegated and to whom. Task shifting — the deliberate reassignment of specific health tasks from higher-qualified to less-qualified (but appropriately trained) workers — is the central human resource management technique for resource-limited health systems. The WHO-recommended task-shifting principle underpins NHM's ASHA model (community mobilisation and basic health promotion delegated to trained community workers), the trained ANM model (normal delivery care at sub-centre level), and the proposed task-shifting for non-communicable disease screening to health and wellness centre teams. Task shifting only works when accompanied by training, supervision, and clear scope-of-practice guidelines.
The organisational culture determinant determines whether quality improvement tools like PDSA cycles are embraced or resisted. A culture where reporting bad outcomes leads to punishment rather than learning will produce falsified HMIS data, not quality improvement. The Kayakalp quality certification programme explicitly addressed this by making quality an aspirational incentive (award and cash prize for high-performing public facilities) rather than a punitive inspection.
The political and administrative determinant affects which techniques are institutionalised. Top-down management cultures — common in hierarchical district health administrations — resist participatory tools (community scorecards, VHSNC accountability mechanisms) even when evidence supports their effectiveness. Awareness of these determinants allows the health manager to select techniques with a realistic chance of adoption.
SELF-CHECK
A district health officer wants to introduce a quality improvement cycle at all PHCs but finds that ANMs routinely under-report maternal complications to avoid accountability. Which of the following management technique determinants is the PRIMARY barrier to effective implementation?
A. Resource and infrastructure determinants — PHCs lack the digital tools for quality tracking
B. Organisational culture determinants — a punitive reporting environment produces falsified data, undermining quality improvement
C. Workforce skill mix determinants — ANMs are not trained to lead PDSA cycles
D. Political determinants — the block health officer has not authorised the initiative
Reveal Answer
Answer: B. Organisational culture determinants — a punitive reporting environment produces falsified data, undermining quality improvement
The primary barrier described is an organisational culture issue: when staff fear that honest reporting of complications will lead to punishment, they falsify data. This is the classic barrier to quality improvement in punitive health system cultures — the PDSA cycle requires honest baseline data ('Study' phase) and safe reporting to function. While skill mix and resources may also matter, the root cause of under-reporting here is the accountability culture, not the absence of tools or training. The solution is to create a psychologically safe reporting environment (which Kayakalp's aspirational award model attempted to do) before introducing improvement tools that depend on accurate data.
Planning and Scheduling Tools: Gantt Chart, PERT, and Logframe
Planning and scheduling tools translate the plan formulation phase of the health planning cycle into an actionable, time-bound, responsibility-assigned implementation roadmap. Three tools are essential for Year-3 Community Medicine: the Gantt chart, PERT/CPM, and the logical framework.
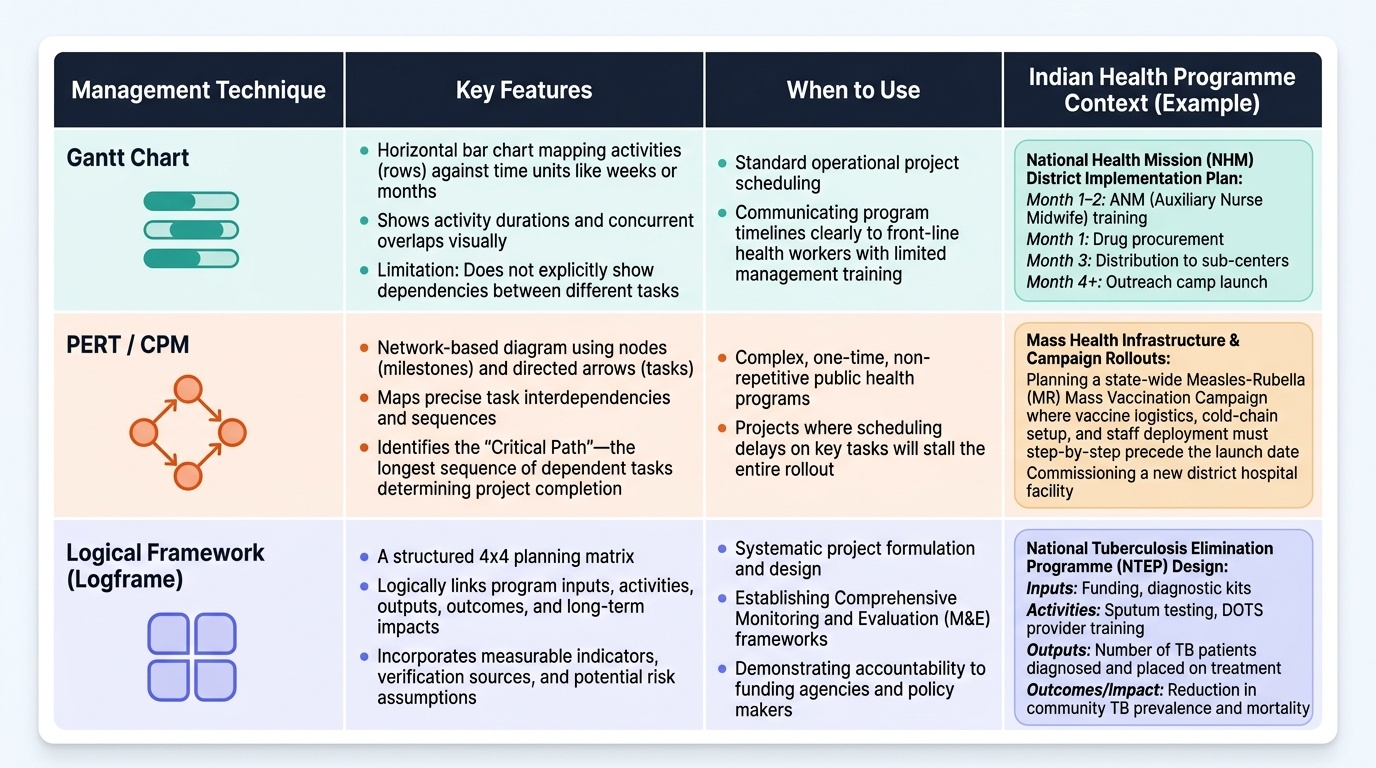
The Gantt chart (named after Henry Gantt, who popularised it in the early 20th century) is a horizontal bar chart in which each row represents an activity and each column represents a time unit (week, month, quarter). Bars extend across the time axis to show activity duration; overlapping bars indicate concurrent activities. It is the most widely used scheduling tool in health programme management because it is visually intuitive, easy to update, and communicable to health workers with limited management training. In an NHM district implementation plan, a Gantt chart would show: ANM training (Month 1-2), drug procurement (Month 1), distribution to sub-centres (Month 3), and outreach camp launch (Month 4 onward) — making scheduling gaps and overlaps immediately visible. Limitation: it does not show task dependencies (which activities must precede others).
The PERT (Programme Evaluation and Review Technique) and CPM (Critical Path Method) address this limitation by using network diagrams that show task interdependencies. In a PERT/CPM network, activities are represented as arrows or nodes; the sequence in which they must occur is shown by the arrows' direction. The critical path is the longest sequence of dependent activities — any delay on the critical path delays the entire project. PERT is especially useful for complex, one-time programmes (e.g., a new district hospital commissioning, a mass vaccination campaign rollout) where identifying the critical path prevents delays. Both PERT and CPM require identifying all activities, their durations, and their dependencies — more effort than a Gantt chart, but more power for complex programme management.
The Logical Framework (Logframe) is a structured accountability tool used widely by international health agencies and adopted in India's programme implementation plans. A logframe matrix has four rows (inputs, activities, outputs, outcomes/impact) and four columns (description, indicators, means of verification, assumptions). It makes explicit the causal logic ('if we provide inputs and carry out activities, outputs will be produced; if outputs occur with the stated assumptions, outcomes will follow'). For NHM, the logframe would show: Input = trained ASHAs + funds + delivery kits; Activities = ANC registration, institutional delivery facilitation, JSSK scheme administration; Outputs = number of institutional deliveries; Outcome = reduction in maternal mortality ratio. The logframe's value is in making the programme's theory of change transparent and verifiable.
Provided image