Page 5 of 32
CM5.{2,4,9,11} | CM5.{2,4,9,11} | Nutritional Assessment and Diet Planning — SDL Guide
Learning Objectives
- Describe and demonstrate the correct method of performing a nutritional assessment of individuals, families, and the community using the ABCD framework
- Plan a diet for an adult that meets macronutrient requirements per ICMR-NIN 2020 RDA for vegetarian, ovo-vegetarian, and non-vegetarian patterns
- Recommend a suitable diet for individuals and families based on local food availability and economic constraints
- Perform nutritional assessment in a simulated setting and plan a diet for health promotion based on the assessment findings
INSTRUCTIONS
Nutritional assessment is the foundation of clinical nutrition practice — without systematically measuring what a patient eats and what their body reflects, dietary advice is a guess. This module teaches you the standard ABCD framework used in community medicine and clinical settings, and then walks you through diet planning as a structured, step-by-step process.
References
- Park's Textbook of Preventive and Social Medicine, 26th ed., Ch. 11 — Nutrition and Health (textbook)
- ICMR-NIN 2020 — Recommended Dietary Allowances and Estimated Average Requirements for Indians (guideline)
- WHO 2006 Child Growth Standards — Weight-for-height, Height-for-age reference charts (guideline)
Version 2.0 | NMC CBUC 2024
CLINICAL SCENARIO
At a health camp in a peri-urban slum, a 35-year-old woman presents for a routine check-up. She appears thin, with dull hair and pallor of the conjunctiva. She reports no specific complaints — she 'feels fine.' Her BMI is 17.2 kg/m², haemoglobin is 9.8 g/dL, and her 24-hour dietary recall reveals a monotonous diet of rice, dal, and small amounts of seasonal vegetables — no dairy, no eggs, no meat. Without systematic assessment using the ABCD framework, this degree of combined undernutrition (protein-calorie + iron deficiency) could easily be missed in a busy outpatient setting. Structured nutritional assessment converts a clinical impression ('she looks thin') into a diagnosis with measurable severity, and a diet plan converts that diagnosis into a practical prescription.
WHY THIS MATTERS
Nutritional assessment and diet planning are core clinical skills, not just academic concepts. CM5.9 explicitly requires you to 'perform nutritional assessment of individual, family and community using appropriate method and plan a diet for health promotion.' This is an OSCE-testable skill. Community medicine postings at Primary Health Centres, Anganwadi visits, and family medicine clinics all involve nutritional assessment as a routine activity. Diet planning for a diabetic or hypertensive patient (CM5.10/CM5.20) starts here — you cannot prescribe a diabetic diet without first assessing the patient's current intake, energy needs, and food preferences. CM5.11 extends this specifically to protein planning across dietary patterns — essential knowledge for a country where 40% of the population is vegetarian and protein-energy malnutrition remains prevalent.
RECALL
From the previous module (cm-nutrition-requirements): recall the ICMR-NIN 2020 protein RDA of 0.83 g/kg/day for adults, the energy reference values (sedentary adult woman ~1660 kcal/day, man ~2110 kcal/day), and the key micronutrient deficiencies of Indian relevance (iron, calcium, iodine, Vitamin A, Vitamin D). From Physiology (PY): recall how basal metabolic rate (BMR) is calculated (Harris-Benedict equation or simplified: men ~24 kcal/kg/day, women ~22 kcal/kg/day) and how activity factors modify it. These values are the quantitative targets that anchor diet planning.
Burden of Malnutrition and Why Assessment Matters
India's malnutrition landscape is characterised not just by its magnitude but by its heterogeneity — undernutrition, micronutrient deficiency, and overnutrition coexist in the same community, often in the same household. NFHS-5 (2019-21) reports that 32.1% of adults have a BMI below 18.5 kg/m², while 24.0% of women have a BMI ≥25. Among children under five, 35.5% are stunted and 19.3% wasted. Anaemia affects 57.0% of women aged 15-49 and 67.1% of children aged 6-59 months. These coexisting patterns mean that clinical impression alone — 'this patient looks well-nourished' — is an unreliable guide.
Systematic nutritional assessment using the ABCD framework (Anthropometric, Biochemical, Clinical, Dietary) addresses this limitation by providing objective, measurable data across four complementary domains. Each domain detects different aspects of nutritional status: anthropometry reflects chronic changes in body composition; biochemical markers detect early, subclinical deficiency before clinical signs appear; clinical assessment identifies established deficiency syndromes; and dietary assessment reveals the cause — what the patient is or is not eating. No single domain is sufficient alone: a patient may have a normal BMI but be iron-deficient (masked by adiposity), or have a low haemoglobin but a normal dietary recall (due to malabsorption). The ABCD framework ensures no domain is missed.
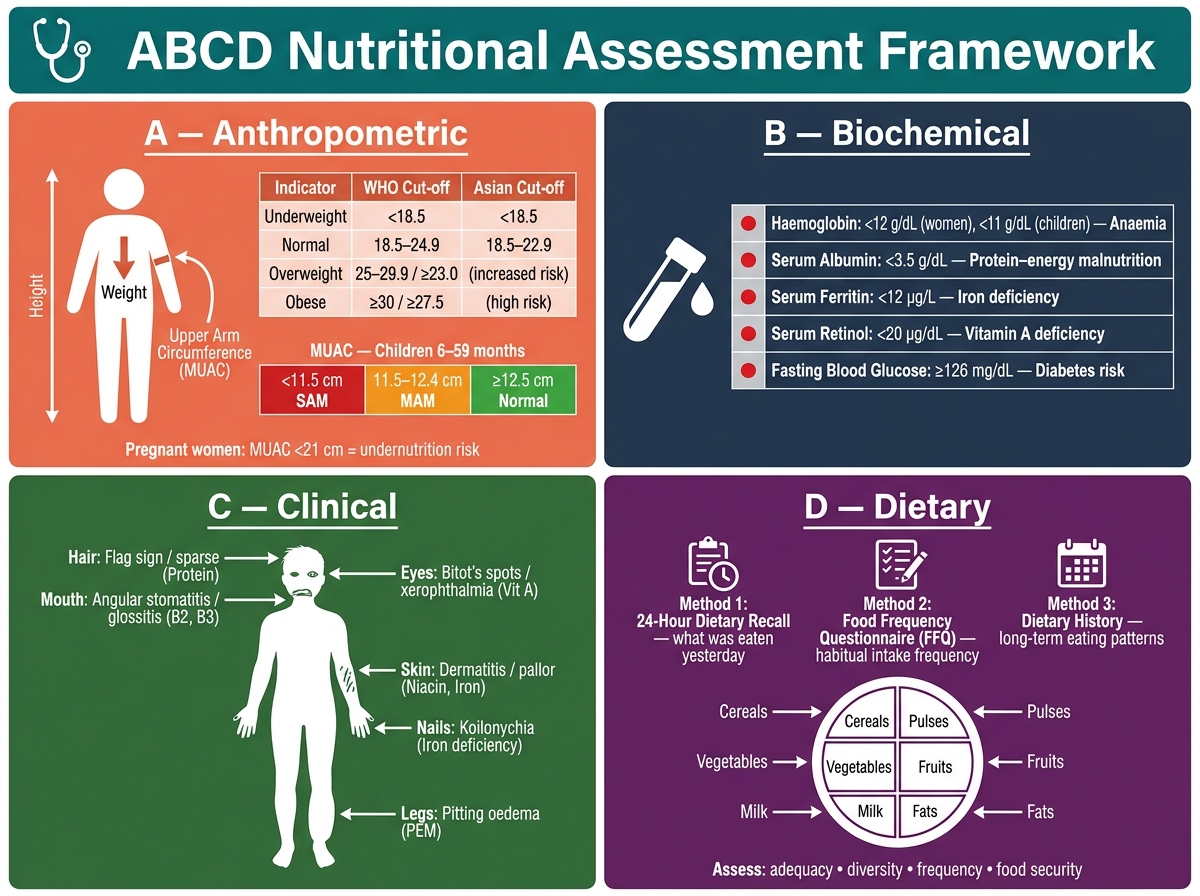
The ABCD Framework for Nutritional Assessment — Key Indicators and Reference Cut-off Values
The ABCD Framework — Anthropometric Assessment
Anthropometric assessment measures body dimensions to evaluate nutritional status. It is the first and most accessible domain — requiring only a calibrated scale, a stadiometer, and a flexible tape measure. Key indices are:
Body Mass Index (BMI) = weight (kg) ÷ height² (m²). Standard WHO classification: <18.5 = underweight; 18.5-24.9 = normal; 25-29.9 = overweight; ≥30 = obese. However, for Indian and Asian populations, the Asia-Pacific cut-offs (WHO 2004) are used: BMI ≥23 = overweight (increased risk), BMI ≥27.5 = obese (high risk). These lower thresholds reflect that Indians accumulate visceral fat at lower BMIs than Western populations, increasing cardiometabolic risk. In clinical practice in India, the Asian BMI cut-offs should be used.
Mid-Upper Arm Circumference (MUAC) is the most practical field tool for community screening, particularly when weighing scales or height measurement is impractical. MUAC cut-offs in children aged 6-59 months: <11.5 cm = Severe Acute Malnutrition (SAM); 11.5-12.4 cm = Moderate Acute Malnutrition (MAM); ≥12.5 cm = normal. For pregnant women, MUAC <21 cm indicates risk of undernutrition. MUAC is used by Anganwadi workers and ASHA workers for community-level screening under ICDS and NRC (Nutrition Rehabilitation Centre) referral pathways.
Waist circumference detects central adiposity independent of BMI. Indian cut-offs: men >90 cm, women >80 cm indicate abdominal obesity and increased cardiometabolic risk (adapted consensus for Asian Indians).
Skinfold thickness at standardised sites (triceps, biceps, subscapular, suprailiac) estimates subcutaneous body fat. Measured with Harpenden or Lange calipers; requires training for reproducibility. Used in research settings and nutrition surveys; less practical in routine clinical care.
Growth monitoring in children uses weight-for-age (underweight: WAZ <-2), height-for-age (stunting: HAZ <-2), and weight-for-height (wasting: WHZ <-2) Z-scores referenced to the WHO 2006 Child Growth Standards. India has shifted from NCHS to WHO 2006 standards across government programmes. Growth charts are used in Anganwadi Centres, RCH registers, and at immunisation sessions.
The ABCD Framework — Biochemical, Clinical and Dietary Assessment
Biochemical assessment provides objective, early evidence of nutritional deficiency before clinical signs appear. Key indicators relevant to India:
- Haemoglobin: cut-offs for anaemia (WHO) — children 6-59 months <11.0 g/dL; non-pregnant women <12.0 g/dL; pregnant women <11.0 g/dL; adult men <13.0 g/dL.
- Serum ferritin: <12 µg/L indicates iron deficiency; <30 µg/L if concurrent infection or inflammation (ferritin is an acute-phase reactant that rises with infection, masking iron deficiency). Ferritin is the most specific early indicator of iron stores.
- Serum albumin: <3.5 g/dL = hypoalbuminaemia, reflecting protein depletion or inflammation. Useful in assessing visceral protein status but is a late marker (long half-life ~20 days).
- Serum retinol: <0.70 µmol/L = Vitamin A deficiency; <0.35 µmol/L = severe deficiency. Used in community surveys; not routinely available in primary care.
- Serum 25-OH Vitamin D: <20 ng/mL = deficiency; 20-30 ng/mL = insufficiency. High prevalence of Vitamin D deficiency in India across all age groups.
Clinical assessment identifies established deficiency syndromes through systematic physical examination:
- Pallor (conjunctival, palmar) → iron deficiency anaemia
- Bitot's spots, xerosis conjunctiva → Vitamin A deficiency
- Goitre → iodine deficiency
- Bow-legs, rachitic rosary → rickets (Vitamin D + calcium deficiency)
- Koilonychia (spoon nails) → iron deficiency
- Glossitis, angular stomatitis → riboflavin (B2), niacin, or iron deficiency
- Oedema (bilateral pitting) in a malnourished child → kwashiorkor
- Muscle wasting with preserved weight → marasmic-kwashiorkor
Dietary assessment identifies the cause of nutritional inadequacy:
- 24-hour dietary recall: patient recalls all food and drink in the previous 24 hours; portion sizes estimated using household measures. Quick, non-literacy-requiring, widely used. Multiple-day recall improves accuracy. Standard method for both clinical assessment and national surveys (NNMB).
- Food frequency questionnaire (FFQ): captures habitual frequency of food group consumption over weeks-months; used in epidemiological research.
- Dietary diversity score: count of food groups consumed in 24 hours — ≥5 of 10 groups (MDD-W, WHO) predicts micronutrient adequacy in women of reproductive age. Used by Anganwadi workers for community monitoring.
- Diet history: detailed qualitative and quantitative account of usual intake over a longer reference period; requires trained interviewer.
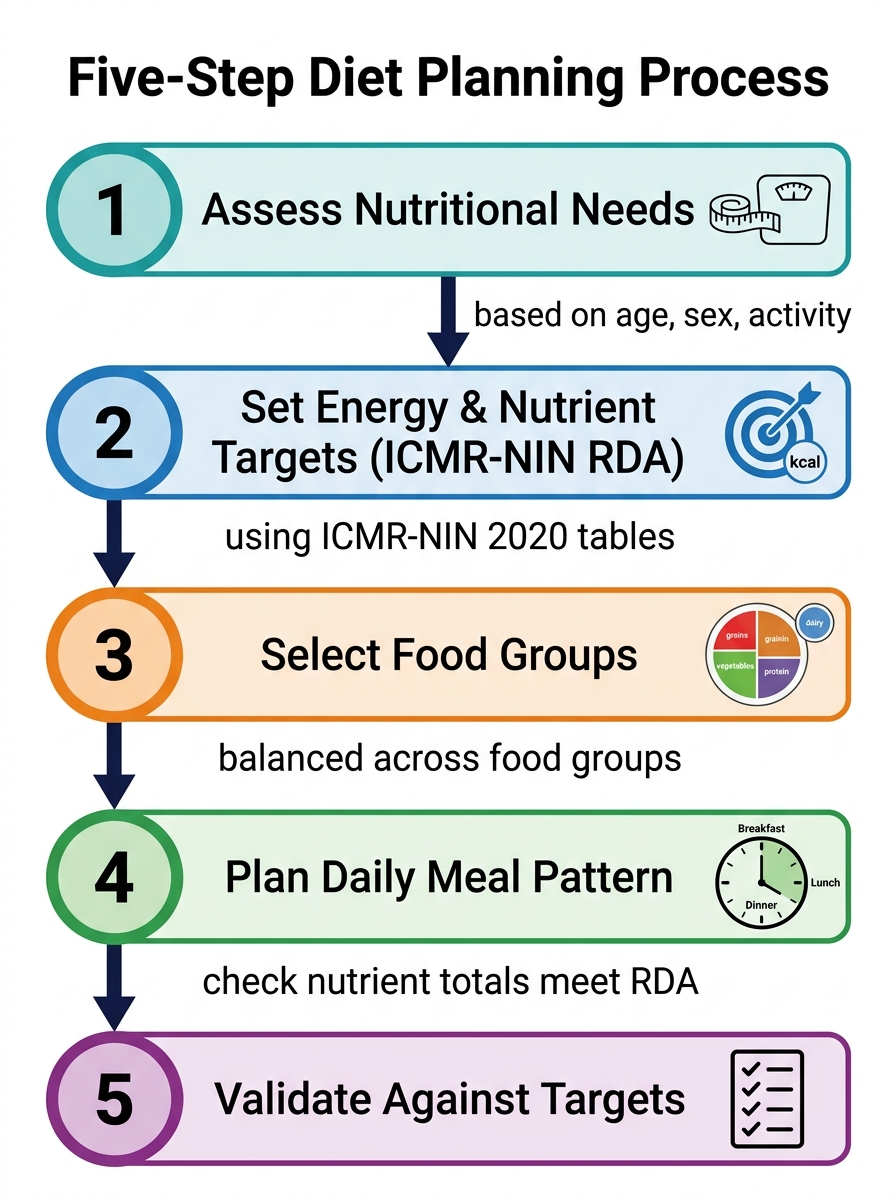
Five-Step Diet Planning Process (ICMR-NIN RDA Framework)
SELF-CHECK
An Anganwadi worker measures a 2-year-old girl and finds her MUAC is 12.0 cm. What is the nutritional classification of this finding?
A. Normal nutritional status
B. Moderate Acute Malnutrition (MAM)
C. Severe Acute Malnutrition (SAM)
D. Severe Stunting
Reveal Answer
Answer: B. Moderate Acute Malnutrition (MAM)
WHO/UNICEF MUAC cut-offs for children 6-59 months: <11.5 cm = SAM; 11.5-12.4 cm = MAM; ≥12.5 cm = normal. A MUAC of 12.0 cm falls within the MAM range. This child should be referred for nutritional rehabilitation but does not meet SAM criteria (which would require therapeutic feeding). Note: MUAC measures wasting (acute malnutrition), not stunting (chronic undernutrition measured by height-for-age).