Page 1 of 27
CM10.1-2 | CM10.1-2 | RMNCH Status and High Risk Screening — SDL Guide
Learning Objectives
- Describe the current status of Reproductive, Maternal, Newborn and Child Health in India using correct mortality indicators and their denominators
- Enumerate and apply methods of screening high-risk groups among mothers, newborns, and children in a community setting
INSTRUCTIONS
India has made remarkable progress in reducing maternal and child deaths, yet thousands of preventable deaths still occur every year. A doctor posted at a Primary Health Centre is the first line of defence — they must know the numbers, recognise who is at risk before a crisis occurs, and link those families to care. This module equips you with the indicator framework and the screening logic that underpin India's RMNCH+A programme.
References
- Park's Textbook of Preventive and Social Medicine, 26th ed., Ch 11 (Reproductive and Child Health) (textbook)
Version 2.0 | NMC CBUC 2024
CLINICAL SCENARIO
A 24-year-old woman in her third trimester arrives at a sub-centre with a haemoglobin of 6.2 g/dL, blood pressure of 148/96 mmHg, and history of one previous caesarean section. The auxiliary nurse-midwife has no clear protocol to follow. She sends the woman home with iron tablets. Two weeks later, the woman is admitted in eclampsia at the district hospital, where she delivers a 1.8 kg preterm baby — both barely survive. Could a structured high-risk screening at booking have changed this outcome?
WHY THIS MATTERS
India still carries one of the world's largest burdens of maternal and under-five deaths in absolute numbers. As a community medicine physician you will calculate these indicators for your district, interpret them against national benchmarks, and deploy screening tools to identify the families most likely to account for tomorrow's deaths. Mastering RMNCH indicators and high-risk screening logic is therefore not academic — it is the entry point for every maternal and child survival programme you will manage.
RECALL
Before we proceed, recall from your epidemiology sessions: the difference between a rate and a ratio; why the denominator matters for inter-district comparisons; and the basic concept of vital statistics surveillance — specifically the Sample Registration System (SRS) and NFHS surveys as primary data sources in India. Also recall from your nutrition module that low birth weight is defined as weight below 2,500 g at birth, and that undernutrition is both a cause and a consequence of the mortality spiral.
RMNCH Burden: Mortality Indicators and India's Status
The global framework for tracking reproductive and child health uses five canonical mortality indicators, each with a precisely defined numerator and denominator — errors in denominator assignment are a leading source of inter-district misinterpretation. The Maternal Mortality Ratio (MMR) is defined as the number of maternal deaths (deaths of women during pregnancy or within 42 days of termination of pregnancy, from causes related to or aggravated by the pregnancy) per 100,000 live births. India's MMR was 97 per 100,000 live births (SRS 2018-20), down from 254 in 2004-06; the SDG 2030 target is below 70. The Infant Mortality Rate (IMR) counts deaths in the first year of life per 1,000 live births; India's NFHS-5 (2019-21) figure is 35.2. The Neonatal Mortality Rate (NMR) captures deaths in the first 28 days per 1,000 live births; NFHS-5 gives 24.9, meaning roughly 70% of infant deaths occur in the neonatal period. The Under-5 Mortality Rate (U5MR) tracks deaths before the fifth birthday per 1,000 live births; India's NFHS-5 value is 41.9. Finally, the Perinatal Mortality Rate (PMR) combines late fetal deaths (stillbirths at ≥28 weeks) and early neonatal deaths (first 7 days) per 1,000 total births; it is particularly sensitive to the quality of intrapartum care. Understanding these five indicators — their numerators, denominators, and current India values — is the foundation for community-level planning.
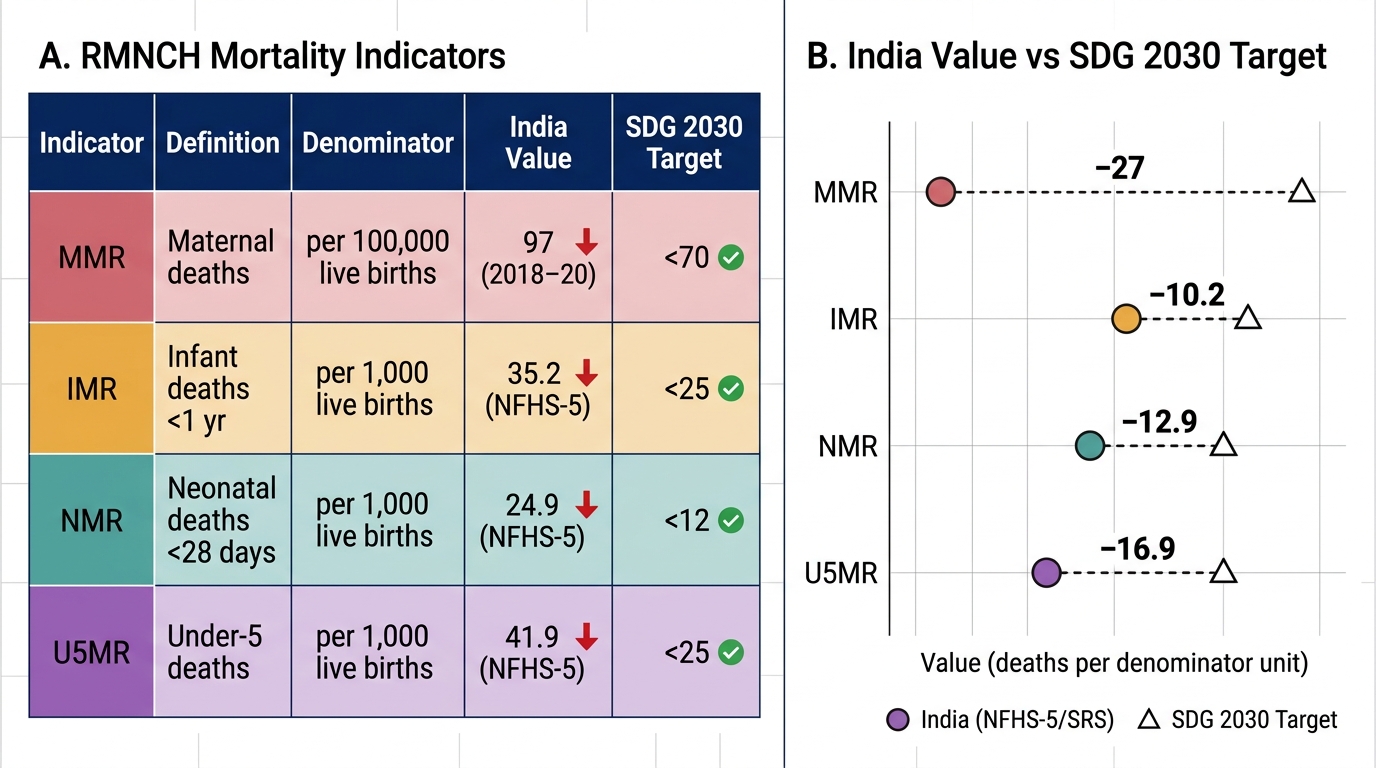
RMNCH Mortality Indicators — India vs SDG 2030 Targets
| Indicator | Numerator | Denominator | India (Latest) | SDG Target |
|---|---|---|---|---|
| MMR | Maternal deaths | 100,000 live births | 97 (SRS 2018-20) | <70 |
| IMR | Infant deaths (<1 yr) | 1,000 live births | 35.2 (NFHS-5) | <25 |
| NMR | Neonatal deaths (<28d) | 1,000 live births | 24.9 (NFHS-5) | <12 |
| U5MR | Under-5 deaths | 1,000 live births | 41.9 (NFHS-5) | <25 |
| PMR | Stillbirths + early NMR | 1,000 total births | ~22 (SRS est.) | — |
Determinants of Maternal and Child Mortality
High maternal and child mortality is never the result of a single cause — it reflects the intersection of proximate (direct biological) causes and distal (socioeconomic, structural) determinants that amplify vulnerability. The five major proximate causes of maternal death globally and in India are: obstetric haemorrhage (leading cause), hypertensive disorders of pregnancy (eclampsia/pre-eclampsia), sepsis, unsafe abortion, and obstructed labour. These clinical causes emerge from a substrate of distal determinants. Anaemia is among the most powerful — a woman with haemoglobin below 7 g/dL who haemorrhages has almost no physiological reserve. Malnutrition, particularly protein-energy undernutrition and micronutrient deficiency, predisposes to low birth weight, intrauterine growth restriction, and neonatal susceptibility. Early marriage and adolescent pregnancy (first birth before age 18) carry two-fold higher obstetric risk because the pelvis and metabolic reserves are not mature. Low socioeconomic status drives distance from facilities, inability to afford transport, and reliance on unqualified providers — all of which delay the three critical care-seeking decisions (recognising danger, deciding to seek care, reaching care). Low literacy compounds this by limiting a woman's ability to decode symptoms, navigate the health system, and advocate for herself. Gender discrimination reduces dietary priority for girls and women, limits autonomy in health decisions, and perpetuates the poverty-malnutrition-mortality cycle. The 3-delays model (delay in recognition, delay in decision, delay in reaching care) synthesises these determinants into an action framework that guides programme design.
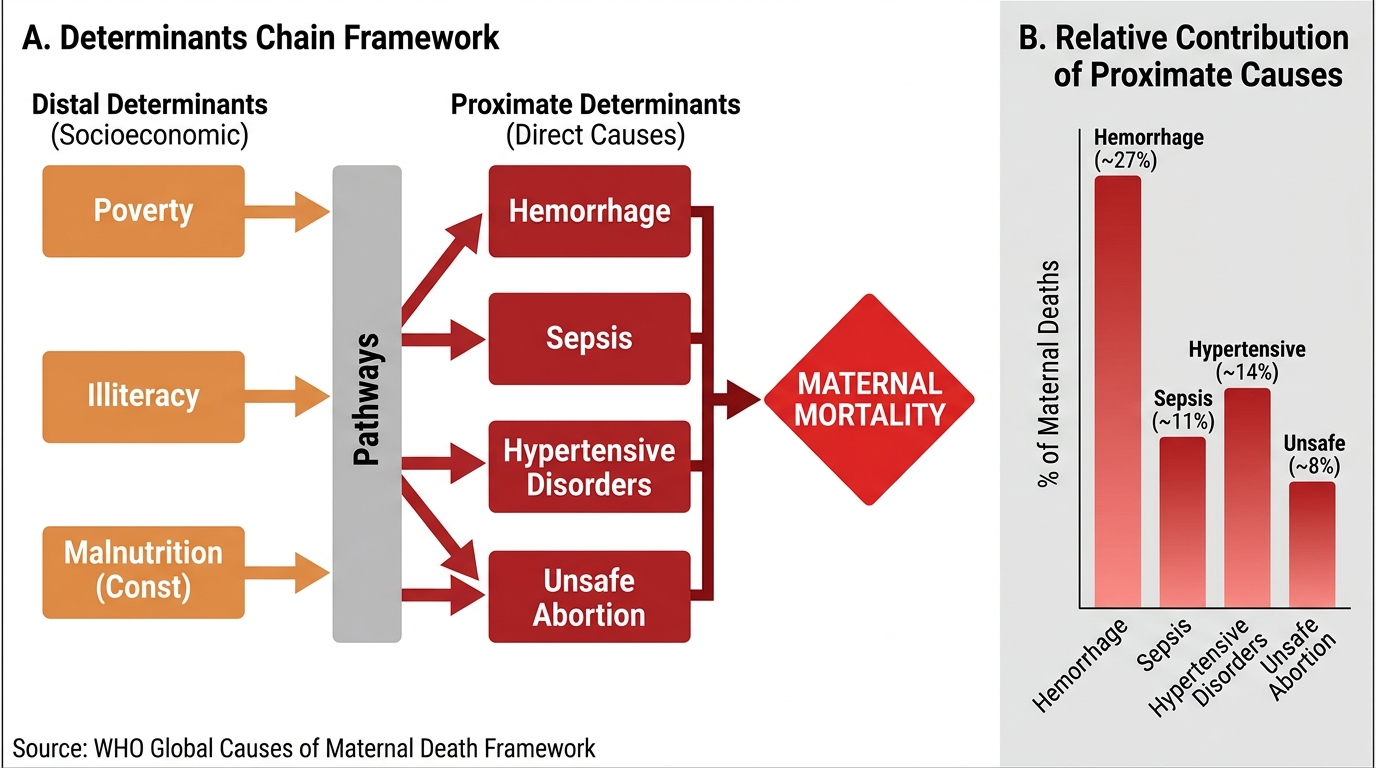
Determinants of Maternal Mortality: Distal–Proximate Chain and Relative Cause Burden
SELF-CHECK
A district reports 45 maternal deaths in a year with 60,000 total births, of which 58,000 are live births. What is the correct MMR for this district?
A. 75 per 100,000 live births
B. 77.6 per 100,000 live births
C. 75 per 100,000 total births
D. 45 per 1,000 live births
Reveal Answer
Answer: B. 77.6 per 100,000 live births
MMR = (maternal deaths / live births) × 100,000 = (45 / 58,000) × 100,000 = 77.6. The denominator is live births, not total births. Option A uses total births (45/60,000 × 100,000 = 75) — a common error. Option D confuses the multiplier (1,000 vs 100,000) used for IMR.
High-Risk Screening Methods for Mothers
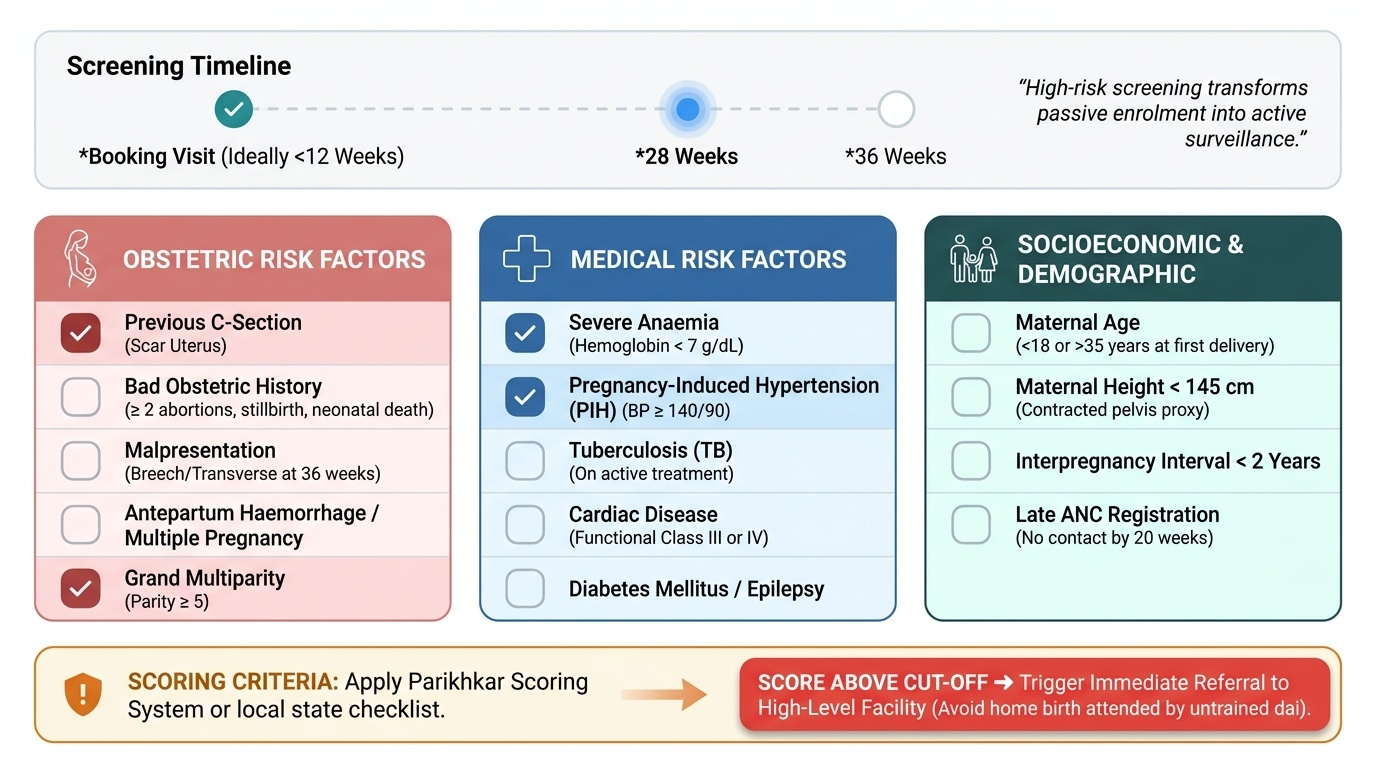
High-risk screening during antenatal care transforms passive enrolment into an active surveillance system: the aim is to identify women whose pregnancies carry above-average risk so that they can receive intensified monitoring or facility-based delivery rather than a home birth attended by an untrained dai. The standard approach categorises maternal risk factors into three domains. Obstetric risk factors include: previous caesarean section (scar uterus risk of rupture), bad obstetric history (two or more consecutive abortions, previous stillbirth, or previous neonatal death), malpresentation at 36 weeks (breech or transverse lie), antepartum haemorrhage, multiple pregnancy, and grand multiparity (parity ≥5). Medical risk factors include severe anaemia (haemoglobin <7 g/dL), pregnancy-induced hypertension (BP ≥140/90 on two readings), tuberculosis on treatment, cardiac disease (functional class III or IV), diabetes mellitus, and epilepsy — any of these dramatically narrows the safe-delivery window at a sub-centre. Socioeconomic and demographic risk factors include age below 18 years or above 35 years at first delivery, height below 145 cm (proxy for contracted pelvis), interpregnancy interval less than 2 years, and no prior antenatal contact by 20 weeks. All three domains are scored systematically using the Parikhkar scoring system or local state-adapted checklists; a score above the cut-off triggers referral to a higher facility. This screening must be done at the first antenatal visit (booking visit, ideally before 12 weeks) and repeated at 28 and 36 weeks.
Provided image