Page 4 of 23
IM10.4-8 | CKD Foundations — SDL Guide
Learning Objectives
- Classify CKD using KDIGO eGFR stages G1–G5 and albuminuria categories A1–A3
- Describe the pathophysiology and clinical manifestations of uraemia affecting major organ systems
- Classify and quantify proteinuria and explain its significance as a CKD progression marker
- Explain the pathophysiology of anaemia of CKD and CKD-mineral bone disorder (CKD-MBD)
- Describe the interrelationship between CKD, hypertension, and glycaemia, including management implications
INSTRUCTIONS
Chronic kidney disease is the silent epidemic of non-communicable disease, affecting approximately 800 million people worldwide, with disproportionate burden in South Asia. This module builds the conceptual architecture of CKD — staging, uraemic pathophysiology, the complications that accumulate as GFR falls, and the key modifiable risk factors. This foundation is essential before approaching the management module.
References
- Harrison's Principles of Internal Medicine, 21st ed., Ch. 308 — Chronic Kidney Disease (textbook)
- API Textbook of Medicine, 10th ed., Ch. Nephrology — Chronic Kidney Disease (textbook)
- KDIGO 2012 Clinical Practice Guideline for the Evaluation and Management of CKD (guideline)
- KDIGO 2017 Clinical Practice Guideline Update for the Diagnosis, Evaluation, Prevention and Treatment of CKD-MBD (guideline)
Version 2.0 | NMC CBUC 2024
CLINICAL SCENARIO
Suresh, a 52-year-old with type 2 diabetes and hypertension, attends a routine outpatient visit. He feels 'a bit tired' but otherwise well. His blood pressure is 148/94 mmHg despite medications. A urine dipstick shows 2+ protein. His creatinine is 1.9 mg/dL and the estimated GFR calculated by the CKD-EPI equation is 38 mL/min/1.73 m². His haemoglobin is 10.2 g/dL — 'anaemia of chronic disease,' the resident writes. His albumin is 3.4 g/dL, phosphate is 5.1 mg/dL, and PTH is 142 pg/mL. Suresh does not yet have symptoms of uraemia — no nausea, no pericarditis, no asterixis. But every one of these findings is a flag: the protein in his urine is accelerating his kidney loss; the rising PTH signals that his bones and cardiovascular system are being silently harmed; the anaemia is impairing his quality of life and straining his heart. CKD rarely announces itself with drama — it accumulates, erodes, and damages every organ system before the patient or clinician notices. Understanding its staging, pathophysiology, and systemic complications is the basis of every intervention that slows progression and prevents the CKD–cardiovascular death spiral.
WHY THIS MATTERS
In India, diabetic nephropathy and hypertensive nephrosclerosis together account for over 50% of patients reaching end-stage renal disease. Glomerulonephritis (IgA nephropathy, FSGS) contributes significantly in younger patients. The burden is amplified by delayed presentation (patients remain asymptomatic through G1–G3 stages), limited access to renal replacement therapy in tier-2 and tier-3 settings, and high cost of dialysis making prevention imperative. For the NMC competencies IM10.4–10.8 (all at KH level), you must demonstrate understanding of CKD staging, uraemic pathophysiology, proteinuria classification, CKD-MBD, anaemia mechanisms, and the hypertension-glycaemia-CKD interaction — the knowledge needed to manage these patients longitudinally in outpatient and inpatient settings.
RECALL
From your earlier study of AKI, recall that the GFR is the volume of plasma filtered per unit time, normally 90–120 mL/min/1.73 m². CKD differs from AKI in being irreversible and slowly progressive over months to years. Recall also that the kidney performs multiple functions beyond filtration: acid-base regulation (excreting H⁺, reabsorbing HCO₃⁻), electrolyte homeostasis (sodium, potassium, phosphate), volume regulation, hormone production (erythropoietin from peritubular fibroblasts, 1,25-dihydroxyvitamin D via proximal tubular 1α-hydroxylase), and renin secretion. As nephron mass falls in CKD, each of these functions is progressively lost — not simultaneously but in a predictable sequence that explains the clinical complications you are about to study.
Defining and Staging CKD — The KDIGO Framework
Chronic kidney disease (CKD) is defined by the KDIGO 2012 guidelines as abnormalities of kidney structure or function that persist for >3 months, with implications for health. The three-month duration criterion is what distinguishes CKD from AKI — it excludes transient, reversible processes. Structural or functional abnormalities include any of: reduced GFR (<60 mL/min/1.73 m²), markers of kidney damage (albuminuria ≥30 mg/g or ≥30 mg/24 h, urine sediment abnormalities, tubular disorders, histological abnormalities on biopsy, structural abnormalities on imaging), or a history of kidney transplantation. Importantly, a patient with a persistently elevated creatinine resulting in GFR 50 mL/min/1.73 m² accompanied by significant albuminuria meets the definition even if previously labelled 'mildly impaired renal function.'
Provided image
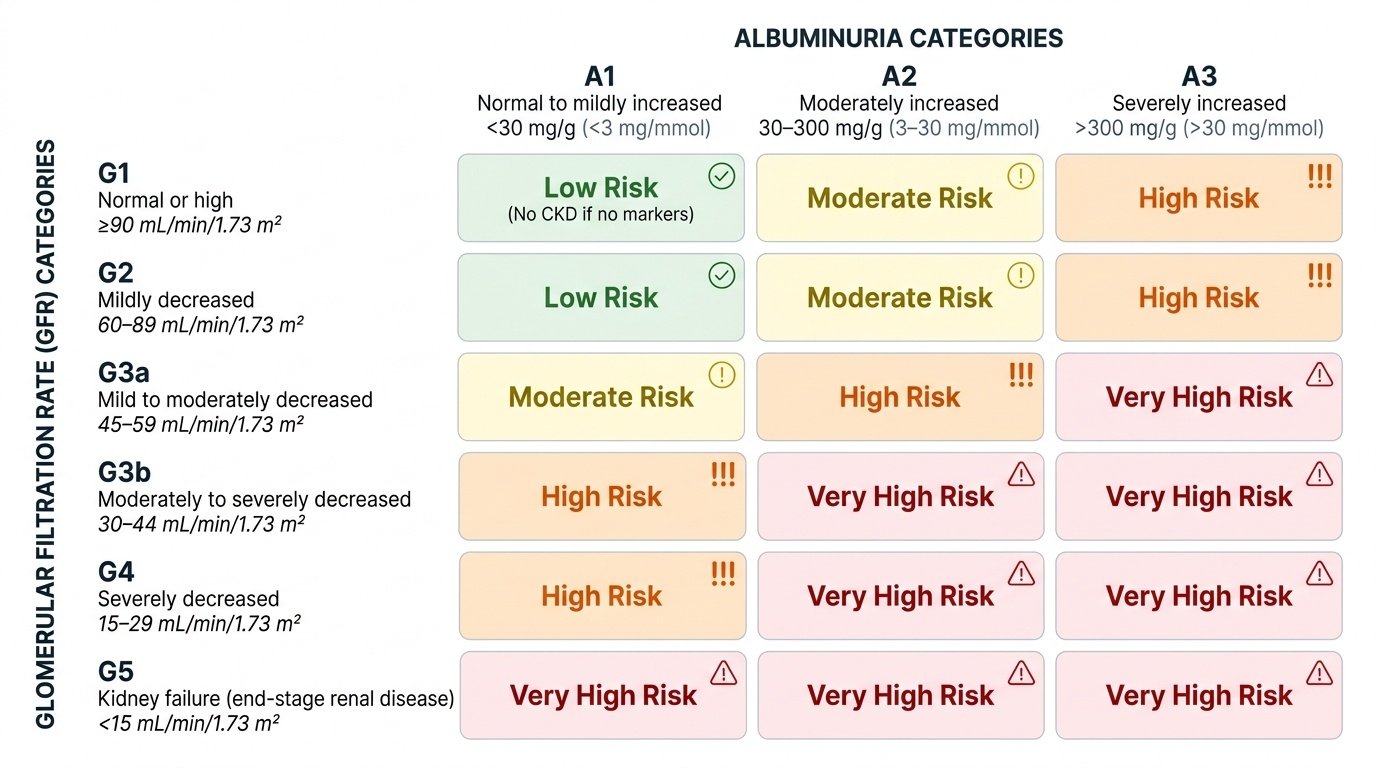
The KDIGO staging system combines two dimensions: the GFR category (G1–G5) and the albuminuria category (A1–A3). This two-dimensional staging system is more informative than GFR alone because albuminuria is an independent predictor of CKD progression, cardiovascular events, and mortality at any given GFR level. A patient at G3a/A3 (eGFR 45–59 with severely increased albuminuria) has a substantially higher risk of progression to end-stage kidney disease than a patient at G3a/A1 with the same eGFR.
| GFR Category | eGFR (mL/min/1.73 m²) | Description |
|---|---|---|
| G1 | ≥90 | Normal or high (requires kidney damage marker for CKD diagnosis) |
| G2 | 60–89 | Mildly decreased |
| G3a | 45–59 | Mild to moderately decreased |
| G3b | 30–44 | Moderately to severely decreased |
| G4 | 15–29 | Severely decreased |
| G5 | <15 | Kidney failure (end-stage renal disease) |
| Albuminuria Category | AER (mg/24 h) or ACR (mg/g) | Description |
|---|---|---|
| A1 | <30 | Normal to mildly increased |
| A2 | 30–300 | Moderately increased (microalbuminuria) |
| A3 | >300 | Severely increased (macroalbuminuria/proteinuria) |
The eGFR is most commonly calculated using the CKD-EPI (Chronic Kidney Disease Epidemiology Collaboration) equation — the current preferred formula, more accurate than the older Cockcroft-Gault and MDRD equations at higher GFR values. Inputs are serum creatinine, age, and sex. Race-adjusted versions are now discouraged by most guidelines following recognition of the problematic basis for the race coefficient. For clinical practice, the eGFR result combined with the albuminuria category generates the KDIGO 'heat map' — a colour-coded risk matrix from green (low risk) to deep red (very high risk for progression, cardiovascular events, and death) — which guides the intensity of monitoring and intervention.
Pathophysiology and Clinical Manifestations of Uraemia
As nephron mass progressively falls through the CKD stages, a constellation of metabolic, endocrine, and toxin-mediated disturbances accumulates — collectively termed uraemia (literally 'urine in the blood'). Uraemia is not caused by a single toxin but by the retention of multiple small and middle molecular-weight compounds normally cleared by the kidney. The principal uraemic toxins include urea itself (historically used as the marker but relatively non-toxic except at very high levels), creatinine, uric acid, middle molecules such as β₂-microglobulin and parathyroid hormone, guanidino compounds (methylguanidine, guanidinosuccinic acid — likely contributors to uraemic encephalopathy and platelet dysfunction), and phenols and indoles (products of gut bacterial metabolism, implicated in cardiovascular disease and cognitive impairment). The kidney also fails to produce erythropoietin and to activate vitamin D, causing the endocrine consequences explored in subsequent sections.
The clinical manifestations of uraemia affect virtually every organ system, with severity correlating broadly with the degree of GFR loss and the rate of accumulation. Understanding the organ-by-organ impact allows the clinician to anticipate, screen for, and manage complications before they become irreversible.
Gastrointestinal: Nausea, anorexia, vomiting, and metallic taste (dysgeusia) are among the earliest uraemic symptoms, caused by urea hydrolysis to ammonia by gut bacteria and by direct effects of uraemic toxins on the gut mucosa. Uraemic gastritis and mucosal erosions predispose to upper GI bleeding. Uraemic fetor — a characteristic fishy or ammoniacal odour of the breath — results from the conversion of urea to ammonia in the saliva. Anorexia and nausea contribute significantly to the protein-energy malnutrition that characterises advanced CKD.
Cardiovascular: Cardiovascular disease is the leading cause of death in CKD patients, accounting for approximately 50% of all mortality. The mechanisms are multiple: traditional risk factors (hypertension, diabetes, dyslipidaemia) are amplified; non-traditional uraemic risk factors include endothelial dysfunction from retained toxins, oxidative stress, chronic inflammation, hyperphosphataemia causing vascular calcification, elevated FGF-23 (which independently causes left ventricular hypertrophy), and anaemia increasing cardiac output demand. Uraemic pericarditis — a fibrinous pericarditis caused by uraemic toxin-induced pericardial inflammation — occurs in advanced CKD and is an indication for dialysis. It presents with fever, pleuritic chest pain, pericardial rub, and ECG changes (diffuse saddle-shaped ST elevation). Uremic cardiomyopathy produces left ventricular hypertrophy and diastolic dysfunction.
Neurological: Uraemic encephalopathy presents with progressive cognitive impairment, disorientation, sleep disturbances, and in advanced cases, asterixis (flapping tremor on wrist extension — a sign of metabolic encephalopathy), myoclonus, seizures, and coma. Peripheral neuropathy (uraemic neuropathy) predominantly affects the lower limbs with a glove-and-stocking sensorimotor pattern and is caused by the demyelinating effect of middle-molecule toxins. Restless legs syndrome is common in CKD and impairs sleep quality significantly.
Haematological: Beyond anaemia (discussed below), uraemic toxins cause platelet dysfunction by impairing platelet aggregation and thromboxane A₂ production — producing a bleeding tendency (prolonged bleeding time, epistaxis, menorrhagia, GI bleeding) despite normal or even elevated platelet counts. This is distinct from thrombocytopenia and is not corrected by transfusions. Treatment options include dialysis (the most effective), conjugated oestrogens, cryoprecipitate (source of von Willebrand factor), and desmopressin (DDAVP) for acute bleeding.
Skin: Uraemic pruritus (intense itching) affects up to 40% of dialysis patients, caused by calcium-phosphate crystal deposition in the skin, secondary hyperparathyroidism, and retained uraemic toxins. Uraemic frost — white crystalline deposits on the skin from urea precipitation through sweat — is a late, dramatic sign rarely seen today with access to dialysis. Pallor from anaemia, ecchymoses from platelet dysfunction, and hyperpigmentation from retained carotene-like toxins are additional skin findings.
Skeletal: Addressed in detail under CKD-MBD below.
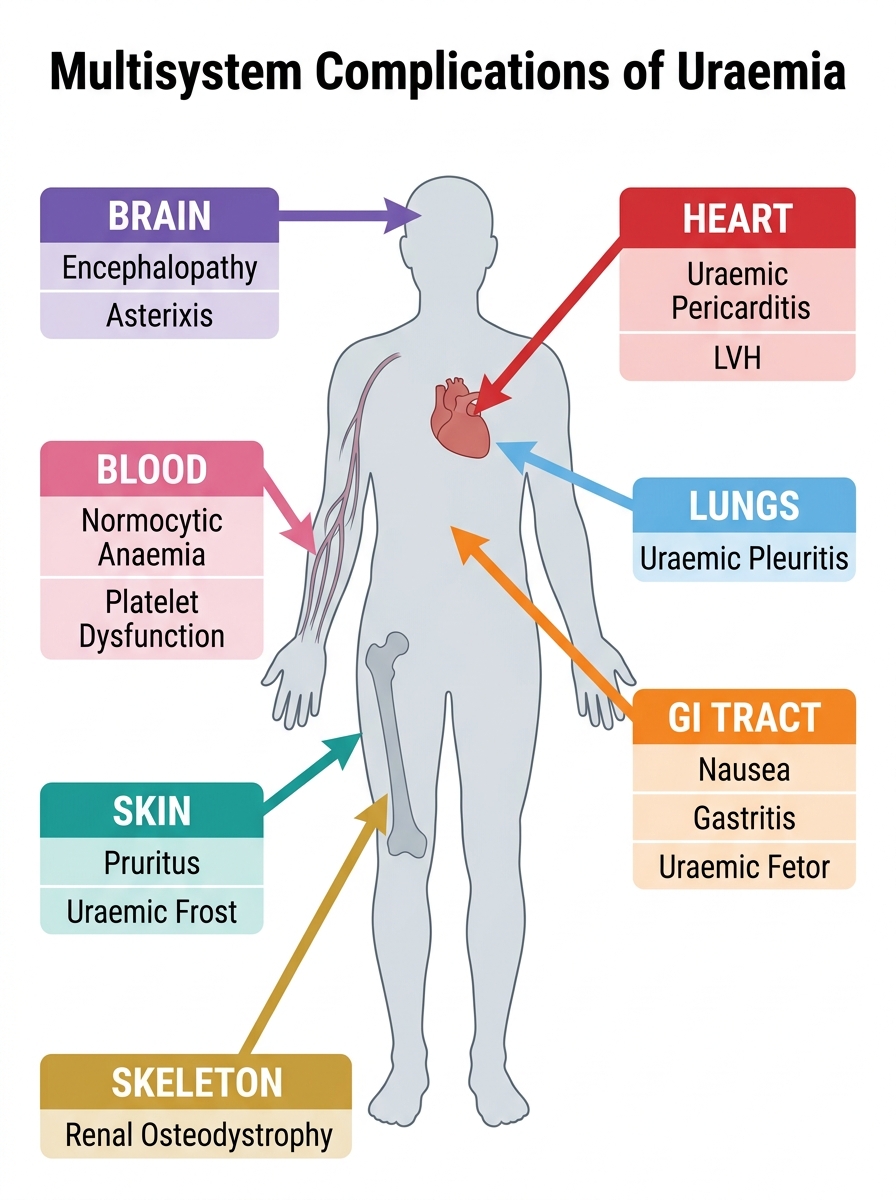
Multisystem Complications of Uraemia
SELF-CHECK
A 60-year-old patient with CKD G4 (eGFR 22 mL/min/1.73 m²) develops pleuritic chest pain and a pericardial friction rub. His haemoglobin is 8.5 g/dL and serum urea is 148 mg/dL. What is the MOST appropriate next management step?
A. Start NSAIDs for pericarditis
B. Urgent echocardiography and initiate dialysis
C. Pericardiocentesis
D. Increase oral sodium bicarbonate supplementation
Reveal Answer
Answer: B. Urgent echocardiography and initiate dialysis
This is uraemic pericarditis — a direct indication for urgent dialysis (the 'U' in AEIOU). NSAIDs are absolutely contraindicated in CKD as they worsen renal function and can cause AKI on CKD. Pericardiocentesis is reserved for cardiac tamponade with haemodynamic compromise, not uncomplicated pericarditis. Bicarbonate addresses metabolic acidosis, not pericarditis. Urgent echocardiography (to exclude effusion with tamponade) combined with initiation of dialysis is the correct approach — dialysis removes uraemic toxins and typically resolves pericarditis within 1–2 weeks.
Proteinuria in CKD — Classification and Significance
Proteinuria — the abnormal presence of protein in the urine — is both a marker of kidney injury and an independent driver of progression. Understanding its classification, quantification methods, and clinical significance is central to CKD management, because the albuminuria category in the KDIGO staging directly influences monitoring frequency, choice of nephroprotective therapy, and prognosis.
Under normal conditions, the glomerular filtration barrier (comprising the fenestrated glomerular endothelium, the glomerular basement membrane with its negatively charged heparan sulfate proteoglycans, and the podocyte slit diaphragm) restricts the passage of large, negatively charged proteins such as albumin. A small amount of albumin is filtered but is almost entirely reabsorbed by megalin and cubilin receptors in the proximal tubule. Normal urinary albumin excretion is <30 mg/24 h (<30 mg/g creatinine by spot urine ACR).
Classification by mechanism and type:
- Glomerular proteinuria: the most clinically important type. Disruption of the glomerular barrier (podocyte injury, basement membrane damage) allows albumin and larger proteins to leak. Predominantly albuminuria. Seen in diabetic nephropathy, glomerulonephritis, and hypertensive nephrosclerosis. When massive (>3.5 g/24 h in adults, >40 mg/m²/h in children), it constitutes nephrotic-range proteinuria and may cause the full nephrotic syndrome (hypoalbuminaemia, oedema, hyperlipidaemia, lipiduria).
- Tubular proteinuria: the tubule fails to reabsorb normally filtered low-molecular-weight proteins (β₂-microglobulin, retinol-binding protein, α₁-microglobulin). Rarely exceeds 2 g/24 h. Seen in Fanconi syndrome, nephrotoxic tubular injury, and tubulointerstitial disease. The urine contains small proteins rather than albumin.
- Overflow proteinuria: occurs when the amount of protein presented to the glomerulus overwhelms tubular reabsorption capacity — e.g., Bence-Jones protein (immunoglobulin light chains) in multiple myeloma, or myoglobin in rhabdomyolysis. The dipstick may be negative or weakly positive (dipstick detects albumin specifically; Bence-Jones protein requires sulfosalicylic acid test or urine electrophoresis).
Quantification methods:
- 24-hour urine protein collection: the gold standard for total protein quantification, but inconvenient and subject to collection errors.
- Spot urine albumin-to-creatinine ratio (ACR): the preferred method in clinical practice. Normalising albumin to creatinine corrects for urine concentration. A first-morning sample is preferred. Results >30 mg/g (two or more occasions, excluding UTI and haematuria) define significant albuminuria. A1 = <30 mg/g; A2 = 30–300 mg/g; A3 = >300 mg/g.
- Urine protein-to-creatinine ratio (PCR): includes both albumin and non-albumin proteins; useful when tubular or overflow proteinuria is suspected.
Significance of proteinuria as a progression marker: Albumin in the tubular lumen activates tubular epithelial cells, triggering release of inflammatory cytokines (MCP-1, NF-κB-mediated IL-6, TNF-α) that recruit interstitial macrophages and drive tubulointerstitial fibrosis — the final common pathway of CKD progression regardless of the initial insult. This mechanism explains why reducing proteinuria with ACE inhibitors or angiotensin receptor blockers (ARBs) slows CKD progression independent of their blood pressure-lowering effect: they reduce intraglomerular pressure (by dilating the efferent arteriole), thereby reducing filtration of albumin and lowering the tubulotoxic albuminuria load.
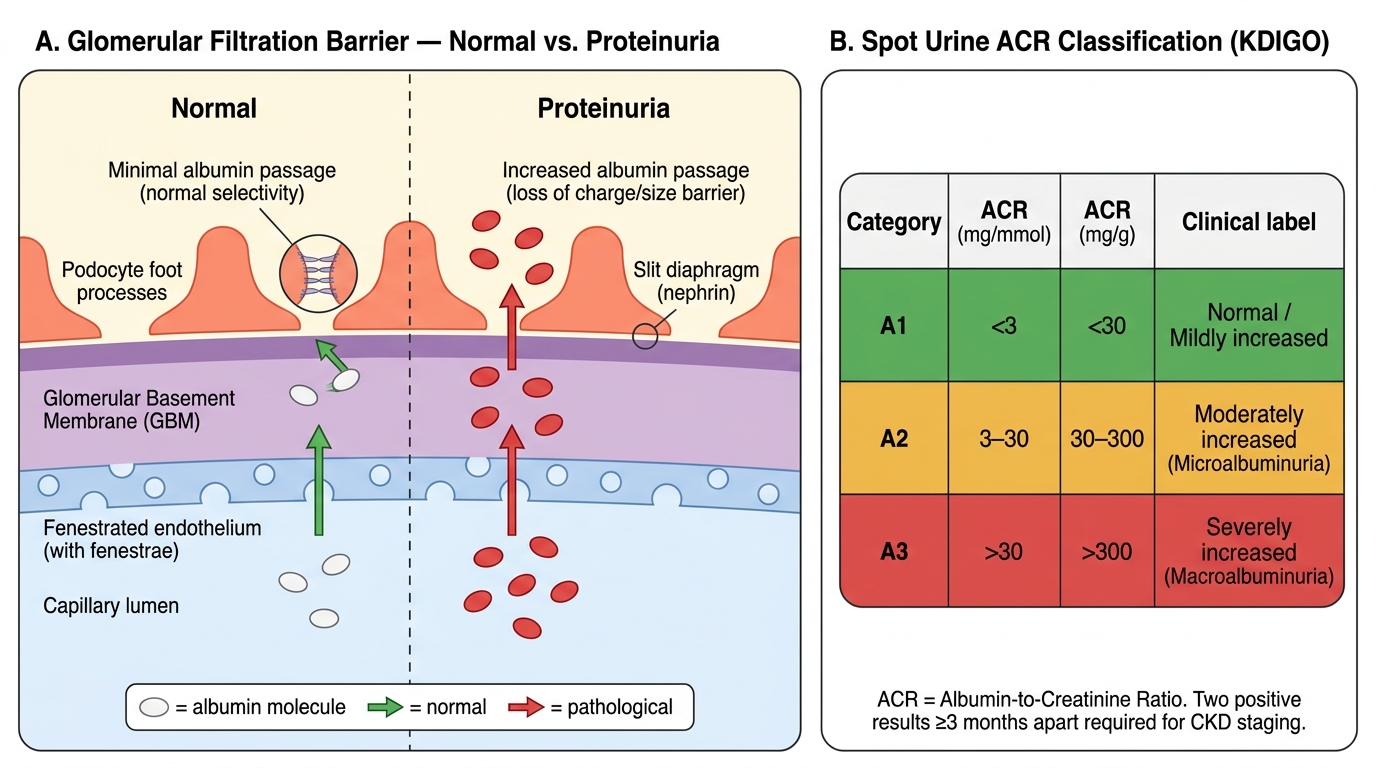
Glomerular Filtration Barrier and Spot ACR Classification