Page 14 of 44
EN2.4 | Audiogram and Impedance Interpretation — SDL Guide (Part 2)
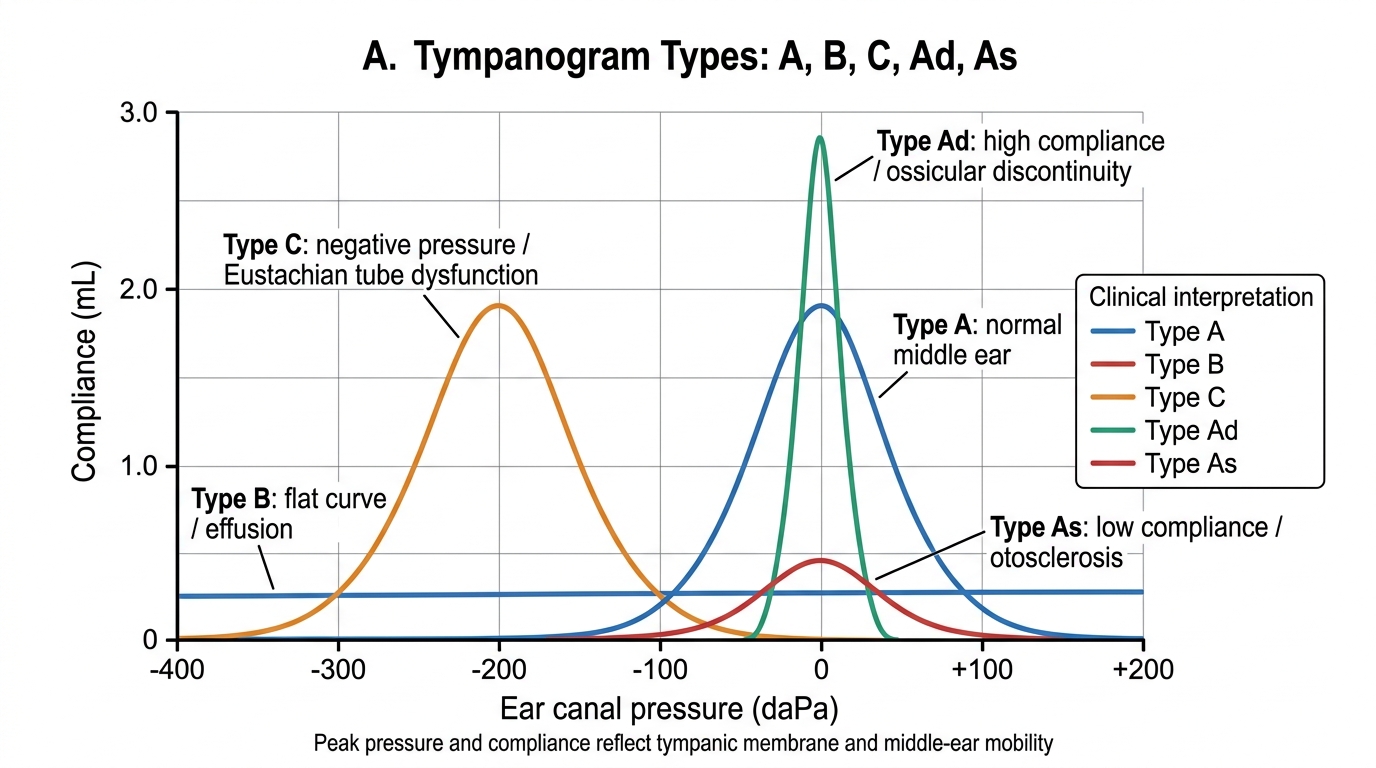
Interpreting the Tympanogram
The tympanogram is plotted with compliance (middle ear mobility, in mL or mmho) on the y-axis and ear canal pressure (in daPa — decaPascals, equivalent to cm H₂O) on the x-axis. The x-axis ranges from +200 daPa (positive pressure) on the left to –400 daPa (negative pressure) on the right. The peak of the tympanogram occurs at the pressure where the middle ear is most compliant — this is the middle ear pressure. Interpreting the tympanogram requires noting the PEAK HEIGHT (compliance), the PEAK POSITION (pressure), and the CURVE SHAPE.
The standard Jerger classification describes five types, each with a distinct clinical correlate. Knowing these types and their meanings is directly tested in ENT examinations and clinical postings.
Type A — Normal: A peaked curve with the peak near 0 daPa (within approximately ±50 daPa of ambient pressure), with a peak compliance of 0.3–1.6 mL. Indicates normal middle ear pressure and normal TM compliance. Clinical significance: normal middle ear; conductive loss in the presence of Type A tympanogram suggests an ossicular chain problem (e.g. fixation in otosclerosis, or discontinuity).
Type As (A-shallow) — Reduced compliance: Same peak position as Type A (near 0 daPa) but the peak height is reduced (compliance <0.3 mL). Indicates a stiff middle ear system. Clinical significance: otosclerosis (stapes footplate fixation) or tympanosclerosis. The TM mobility is reduced because the ossicular chain is fixed.
Type Ad (A-deep/discontinuity) — Increased compliance: Peak near 0 daPa but very high peak height (>1.6 mL). Indicates a hypermobile system. Clinical significance: ossicular chain discontinuity (e.g. incudostapedial joint disruption, as in trauma or chronic CSOM). The TM moves too freely because the ossicular chain is not providing normal resistance.
Type B — Flat (no peak): No identifiable peak across the entire pressure range. The curve is flat or nearly flat. Clinical significance: middle ear effusion (otitis media with effusion — 'glue ear'), in which the fluid-filled middle ear damps all mobility — OR a TM perforation (in which case the probe pressurises the entire middle ear and mastoid air cell system, giving a flat high-compliance curve; check the ear canal volume — a large canal volume with a flat curve = perforation, not effusion). Type B is the most important tympanogram type to recognise in children with chronic hearing loss.
Type C — Negative pressure peak: The tympanogram has a clear peak but the peak is at significantly negative pressure (typically more negative than –150 to –200 daPa). The middle ear is under negative pressure. Clinical significance: Eustachian tube dysfunction — the Eustachian tube is failing to equalise middle ear pressure, resulting in a partial vacuum in the middle ear.
Comparison of Tympanogram Types
SELF-CHECK
A 7-year-old child presents with bilateral hearing loss for 3 months. PTA shows bilateral flat conductive hearing loss (AC elevated, BC normal, ABG present at all frequencies). Tympanograms are Type B bilaterally (flat, no peak) with normal ear canal volumes. The most likely diagnosis is:
A. Bilateral acute suppurative otitis media
B. Bilateral otitis media with effusion (secretory otitis media / glue ear)
C. Bilateral tympanic membrane perforations
D. Bilateral otosclerosis
Reveal Answer
Answer: B. Bilateral otitis media with effusion (secretory otitis media / glue ear)
Bilateral flat Type B tympanograms with NORMAL ear canal volumes in a child with conductive hearing loss = otitis media with effusion (OME, 'glue ear'). The fluid in the middle ear abolishes TM mobility, producing the flat tympanogram. Normal canal volume rules out TM perforation (which would give a flat Type B but with markedly increased canal volume, as the probe communicates with the entire middle ear and mastoid air cell system). Acute OM would be diagnosed on otoscopy (red, bulging TM) with fever; otosclerosis is rare in children and gives Type As.
Identifying Hearing Loss Type and Severity from the Audiogram
The audiogram classification by type and severity is the core interpretive skill in EN2.4. Once the symbols are read correctly, the pattern of AC vs BC thresholds, the presence or absence of an ABG, and the configuration of the curves allow the audiogram to be classified unambiguously in most cases.
Classification by type:
Conductive hearing loss: AC thresholds are elevated above normal (>25 dB HL) at one or more frequencies; BC thresholds are normal (within 25 dB HL at each frequency); the air-bone gap (ABG) is >15 dB at the affected frequencies. The audiogram curve for AC lies below (worse than) the BC curve, with a visible gap between them. The tympanogram is typically Type B (effusion), Type As (otosclerosis), or Type Ad (ossicular discontinuity) depending on the cause — although Type A is also possible (e.g. in TM perforation where middle ear compliance appears normal on tympanometry but the hole in the TM impairs AC).
Sensorineural hearing loss (SNHL): BOTH AC and BC thresholds are elevated above normal at the affected frequencies; the curves for AC and BC run closely parallel (within 15 dB of each other, i.e. no significant ABG). The cochlea and/or auditory nerve are damaged, impairing both sound pathways equally. Tympanogram is typically Type A (middle ear is structurally normal). Configuration varies: high-frequency slope (presbycusis, noise-induced), low-frequency notch (Meniere's), flat (congenital/hereditary).
Mixed hearing loss: BOTH AC and BC thresholds are elevated (SNHL component), AND an ABG >15 dB is present (additional conductive component superimposed on the SNHL). For example, a patient with presbycusis (SNHL) who also has wax impaction (adding conductive component) will show elevated BC (SNHL) with AC worse than BC (ABG from wax).
Severity classification (ASHA, widely cited in Dhingra):
| PTA (dB HL) | Degree of hearing loss |
|---|---|
| 0–25 dB | Normal |
| 26–40 dB | Mild |
| 41–55 dB | Moderate |
| 56–70 dB | Moderately severe |
| 71–90 dB | Severe |
| >90 dB | Profound |
The pure tone average (PTA) for the severity classification is the average of AC thresholds at 500, 1000, and 2000 Hz. (Some guidelines include 3000 Hz as the fourth frequency — the choice of frequencies should be consistent within an audiological reporting system.) The PTA is used for hearing aid prescription, disability assessment, and surgical outcome measurement.
Audiogram-TFT concordance check: The tuning fork test findings (Rinne, Weber, ABC) from the clinical examination should be concordant with the audiogram findings. Rinne NEGATIVE on one side = conductive loss on that side = ABG on the audiogram for that ear. Weber to one side = that side has the greater loss (either CHL on that side or SNHL on the other side). ABC reduced = SNHL on that side = BC thresholds elevated on the audiogram. Discordance between TFTs and audiogram should prompt re-examination of both.
CLINICAL PEARL
The 4000 Hz notch on the PTA is the audiological signature of noise-induced hearing loss (NIHL) and is one of the most examined audiogram patterns. The notch appears because the basal cochlear hair cells responsible for encoding 4000 Hz are structurally most vulnerable to acoustic trauma — they lie at the point of maximum vibration amplitude for sounds at that frequency. Importantly, the 4000 Hz notch occurs at a frequency above the main speech range (500–3000 Hz), which explains why early NIHL is often not perceived by the patient as a communication problem — they can still hear speech reasonably well but lose sensitivity at 4000 Hz. This makes occupational screening audiograms (which check 4000 Hz) the primary tool for early NIHL detection. An early 4000 Hz notch that is detected and acted upon (by removing the worker from noise exposure and providing hearing protection) can prevent progression to a disabling hearing loss. Recovery is NOT possible once NIHL has occurred — the dead hair cells do not regenerate.
Applied Practice: Integrated Audiological Scenarios
The following scenarios each present a clinical situation and an audiological result. Work through the interpretation systematically — classify by type, severity, and configuration, then correlate with the clinical picture. The ability to read an audiogram and immediately recognise the pattern is a skill built by repeated exposure, and these scenarios provide structured practice toward that automatic recognition.
Scenario 1 — CSOM with conductive hearing loss:
Patient: 32-year-old male with chronic right ear discharge.
Audiogram right ear: AC thresholds 45 dB at 500 Hz, 40 dB at 1000 Hz, 35 dB at 2000 Hz, 30 dB at 4000 Hz. BC thresholds: 10 dB at all frequencies.
Left ear: all thresholds within 20 dB HL.
Tympanogram right: Type B (flat curve, normal ear canal volume). Left: Type A.
Interpretation: Right ear ABG = 40–35 dB at most frequencies = RIGHT CONDUCTIVE HEARING LOSS. BC normal = cochlea intact. Type B tympanogram (flat) — since the patient has a TM perforation (CSOM), check canal volume: if large, the flat curve is from perforation communicating with the middle ear. PTA right = (45+40+35)/3 = 40 dB HL = MODERATE conductive hearing loss. Left ear normal.
Clinical significance: Tympanoplasty (TM repair) should close the ABG and restore near-normal hearing if ossicles are intact.
Scenario 2 — Presbycusis (age-related SNHL):
Patient: 68-year-old retired male with bilateral gradually progressive hearing loss.
Audiogram: Bilateral high-frequency sloping loss. AC = BC at all frequencies (no ABG). At 4000 Hz right: AC 60 dB, BC 55 dB. At 1000 Hz right: AC 25 dB, BC 20 dB.
Tympanograms: Type A bilaterally.
Interpretation: Bilateral high-frequency sloping SNHL (AC ≈ BC, no ABG, Type A tympanograms). PTA right at 500-1000-2000 Hz = approximately 25-30 dB HL = mild SNHL in speech frequencies. The high-frequency loss is classic for presbycusis. The tympanograms confirm normal middle ear function — this is entirely a cochlear/hair cell problem.
Management: Hearing aids are the mainstay; surgical options (TM repair, stapes surgery) are not indicated for SNHL.
Scenario 3 — Early Meniere's disease:
Patient: 40-year-old female with episodic left vertigo and fluctuating left hearing loss.
Audiogram during a symptomatic period: Left ear — LOW-FREQUENCY loss: AC 50 dB at 250 Hz, 40 dB at 500 Hz, normal at 2000–8000 Hz. BC follows AC closely (no ABG).
Interpretation: Left low-frequency SNHL (ascending audiogram configuration = worst at low frequencies). No ABG. Type A left tympanogram. This low-frequency SNHL in the context of episodic vertigo + tinnitus is characteristic of Meniere's disease (endolymphatic hydrops). The audiogram fluctuates with the disease activity — it may be near-normal between episodes early in the disease.