Page 2 of 7
BI3.1-6 | Chemistry and Metabolism of Carbohydrates — SDL Guide (Part 2)
Gluconeogenesis — Making Glucose When You Haven't Eaten (BI3.3)
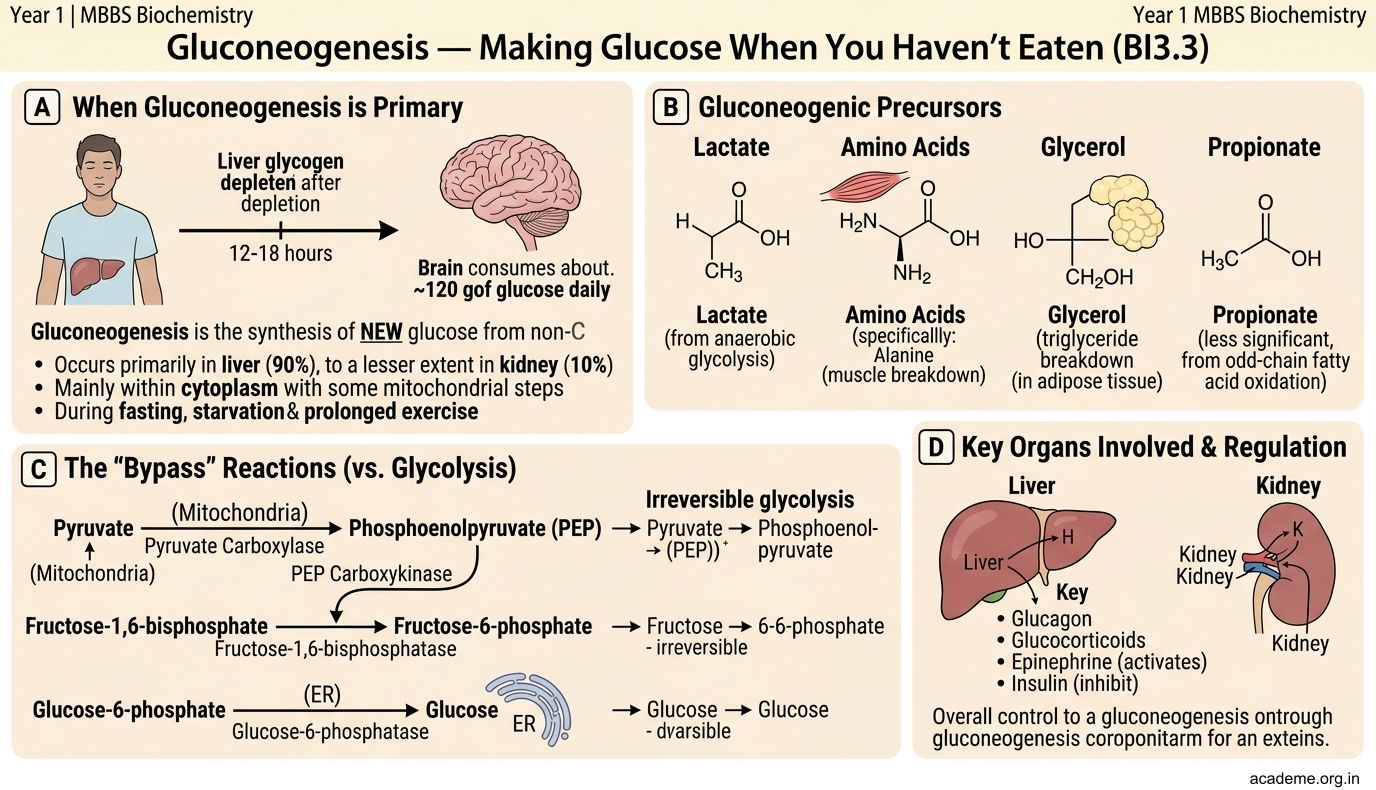
Gluconeogenesis = synthesis of NEW glucose from non-carbohydrate precursors. It occurs primarily in the liver (90%) and to a lesser extent in the kidney (10%), mainly in the cytoplasm (with some mitochondrial steps).
When does your body need this? During fasting (after liver glycogen is depleted, ~12-18 hours), starvation, and prolonged exercise. The brain consumes ~120g glucose/day and CANNOT use fatty acids — so the body MUST make glucose to keep you conscious.
Precursors (non-carbohydrate sources of glucose):
• Lactate — from anaerobic glycolysis in RBCs and exercising muscle → carried to liver → converted back to glucose. This is the Cori cycle (lactate → liver → glucose → blood → muscle → lactate → repeat)
• Glycerol — from breakdown of triglycerides (fat stores)
• Glucogenic amino acids — especially alanine (from muscle protein breakdown → carried to liver → converted to pyruvate → glucose). This is the glucose-alanine cycle
• Fatty acids CANNOT be converted to glucose (because acetyl-CoA cannot regenerate pyruvate — the pyruvate dehydrogenase reaction is irreversible). This is why prolonged starvation leads to muscle wasting — the body breaks down protein, not fat, to make glucose.
The pathway — mostly glycolysis in reverse, with 3 bypass reactions:
Glycolysis has 3 irreversible steps (hexokinase, PFK-1, pyruvate kinase). Gluconeogenesis uses DIFFERENT enzymes to bypass each:
- Pyruvate → Oxaloacetate → Phosphoenolpyruvate (PEP): Enzymes: pyruvate carboxylase (mitochondria, requires biotin) + PEP carboxykinase (PEPCK, cytoplasm). This bypasses pyruvate kinase.
- Fructose-1,6-bisphosphate → Fructose-6-phosphate: Enzyme: fructose-1,6-bisphosphatase. This bypasses PFK-1.
- Glucose-6-phosphate → Glucose: Enzyme: glucose-6-phosphatase (only in liver and kidney — this is why muscle cannot release free glucose into blood; it lacks this enzyme).
Regulation — reciprocal to glycolysis:
• Fasting/glucagon → stimulates gluconeogenesis (activates PEPCK, F-1,6-BPase) and inhibits glycolysis
• Fed state/insulin → stimulates glycolysis (activates PFK-1) and inhibits gluconeogenesis
• Fructose-2,6-bisphosphate is the master switch: high F-2,6-BP activates PFK-1 (glycolysis ON) and inhibits F-1,6-BPase (gluconeogenesis OFF). Glucagon lowers F-2,6-BP; insulin raises it.
Clinical pearl: Metformin, the first-line drug for type 2 diabetes, works partly by inhibiting hepatic gluconeogenesis — reducing the liver's production of glucose. Alcohol also inhibits gluconeogenesis (by increasing NADH/NAD⁺ ratio), which is why heavy drinkers can develop dangerous hypoglycaemia.
Glycogen Metabolism — Your Glucose Buffer (BI3.3)
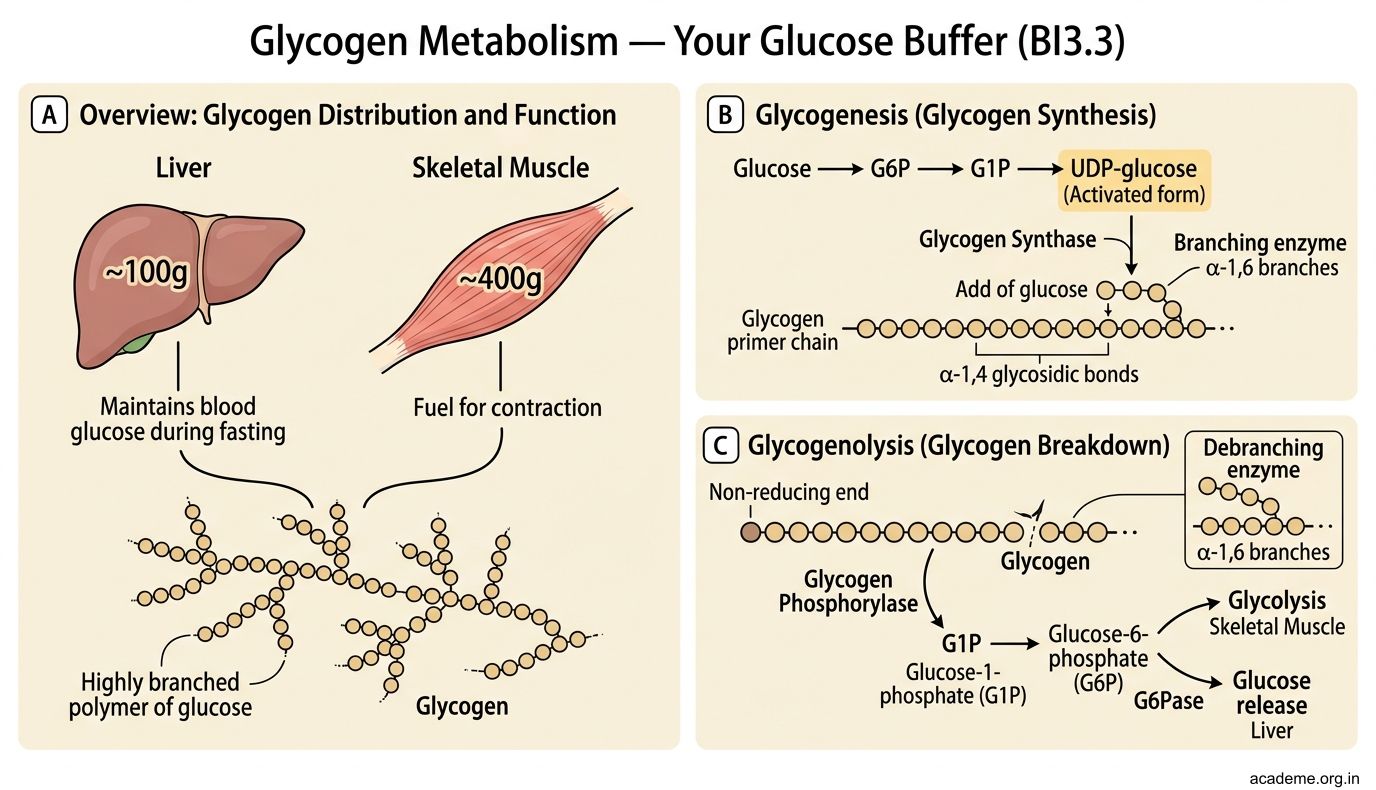
Glycogen is your body's short-term glucose reserve — a highly branched polymer of glucose stored in liver (~100g, maintains blood glucose during fasting) and skeletal muscle (~400g, fuel for contraction).
Glycogenesis (glycogen synthesis):
Glucose → G6P → G1P → UDP-glucose (the activated form) → added to a glycogen primer chain by glycogen synthase (adds glucose via α-1,4 bonds). Branching enzyme creates α-1,6 branch points every 8-12 residues.
Why so much branching? Each branch end is a site where glucose can be quickly removed. More branches = faster glucose mobilisation. Glycogen is designed for SPEED, not long-term storage (that's fat's job).
Glycogenolysis (glycogen breakdown):
Glycogen phosphorylase cleaves α-1,4 bonds from the non-reducing ends, releasing glucose-1-phosphate (G1P). Debranching enzyme handles the α-1,6 branch points (releasing free glucose). G1P → G6P → glucose (in liver, via glucose-6-phosphatase) or enters glycolysis directly (in muscle).
Regulation — the hormonal seesaw:
• Glucagon (from pancreatic α-cells, during fasting) → activates glycogenolysis + inhibits glycogenesis in the liver. Mechanism: glucagon → cAMP → protein kinase A → phosphorylates glycogen phosphorylase (activates it) AND glycogen synthase (inactivates it)
• Insulin (from pancreatic β-cells, after eating) → activates glycogenesis + inhibits glycogenolysis. Mechanism: insulin → dephosphorylation cascades → opposite effects
• Epinephrine (adrenaline) → activates glycogenolysis in muscle (fight-or-flight: need instant glucose for sprinting). Also works in liver.
Glycogen Storage Diseases (GSDs):
These are genetic enzyme deficiencies that cause abnormal glycogen accumulation:
• Von Gierke disease (GSD I) — deficiency of glucose-6-phosphatase → liver cannot release free glucose → severe fasting hypoglycaemia, hepatomegaly, lactic acidosis
• McArdle disease (GSD V) — deficiency of muscle glycogen phosphorylase → exercise intolerance, muscle cramps, myoglobinuria (no glycogen breakdown during exercise)
• Pompe disease (GSD II) — deficiency of lysosomal acid maltase (α-1,4-glucosidase) → glycogen accumulates in lysosomes → cardiomegaly, muscle weakness, fatal in infantile form
HMP Shunt and Minor Pathways (BI3.3, BI3.4)
Hexose Monophosphate (HMP) Shunt (= Pentose Phosphate Pathway)
This alternative pathway for glucose-6-phosphate serves TWO purposes:
1. Generates NADPH — needed for fatty acid synthesis, steroid synthesis, and maintaining reduced glutathione (protects RBCs from oxidative damage)
2. Produces ribose-5-phosphate — needed for nucleotide synthesis (DNA and RNA)
Occurs in the cytoplasm. Two phases:
• Oxidative phase (irreversible): G6P → 6-phosphogluconate → ribulose-5-phosphate. Rate-limiting enzyme: glucose-6-phosphate dehydrogenase (G6PD). Produces 2 NADPH.
• Non-oxidative phase (reversible): Interconversions of sugars (ribose-5-phosphate ↔ fructose-6-phosphate, glyceraldehyde-3-phosphate)
G6PD deficiency — the most common enzyme deficiency worldwide (400 million affected, X-linked). Without G6PD → low NADPH → low reduced glutathione → RBCs vulnerable to oxidative stress → haemolytic anaemia triggered by:
• Drugs: primaquine (antimalarial), dapsone, sulfonamides
• Foods: fava beans ("favism")
• Infections
Minor Carbohydrate Pathways (BI3.4):
- Fructose metabolism — Fructose is metabolised in the liver by fructokinase → fructose-1-phosphate → cleaved by aldolase B → enters glycolysis. Hereditary fructose intolerance = aldolase B deficiency → fructose-1-phosphate accumulates → liver damage, hypoglycaemia. Essential fructosuria = fructokinase deficiency → benign (fructose in urine).
- Galactose metabolism — Galactose → galactose-1-phosphate → UDP-galactose → UDP-glucose → enters glycolysis. Key enzyme: galactose-1-phosphate uridylyl transferase. Classic galactosaemia = deficiency of this enzyme → galactose-1-phosphate accumulates → cataracts, liver damage, intellectual disability. Treatment: remove ALL lactose from diet.
- Polyol (sorbitol) pathway — Glucose → sorbitol (by aldose reductase, using NADPH) → fructose (by sorbitol dehydrogenase). In diabetes, chronic hyperglycaemia drives excess sorbitol production in tissues that don't require insulin for glucose entry (lens, retina, peripheral nerves, kidneys). Sorbitol is trapped inside cells → osmotic damage → diabetic cataracts, retinopathy, neuropathy, nephropathy. This is a key mechanism of diabetic complications.
Blood Glucose Regulation and Diabetes Mellitus (BI3.5)
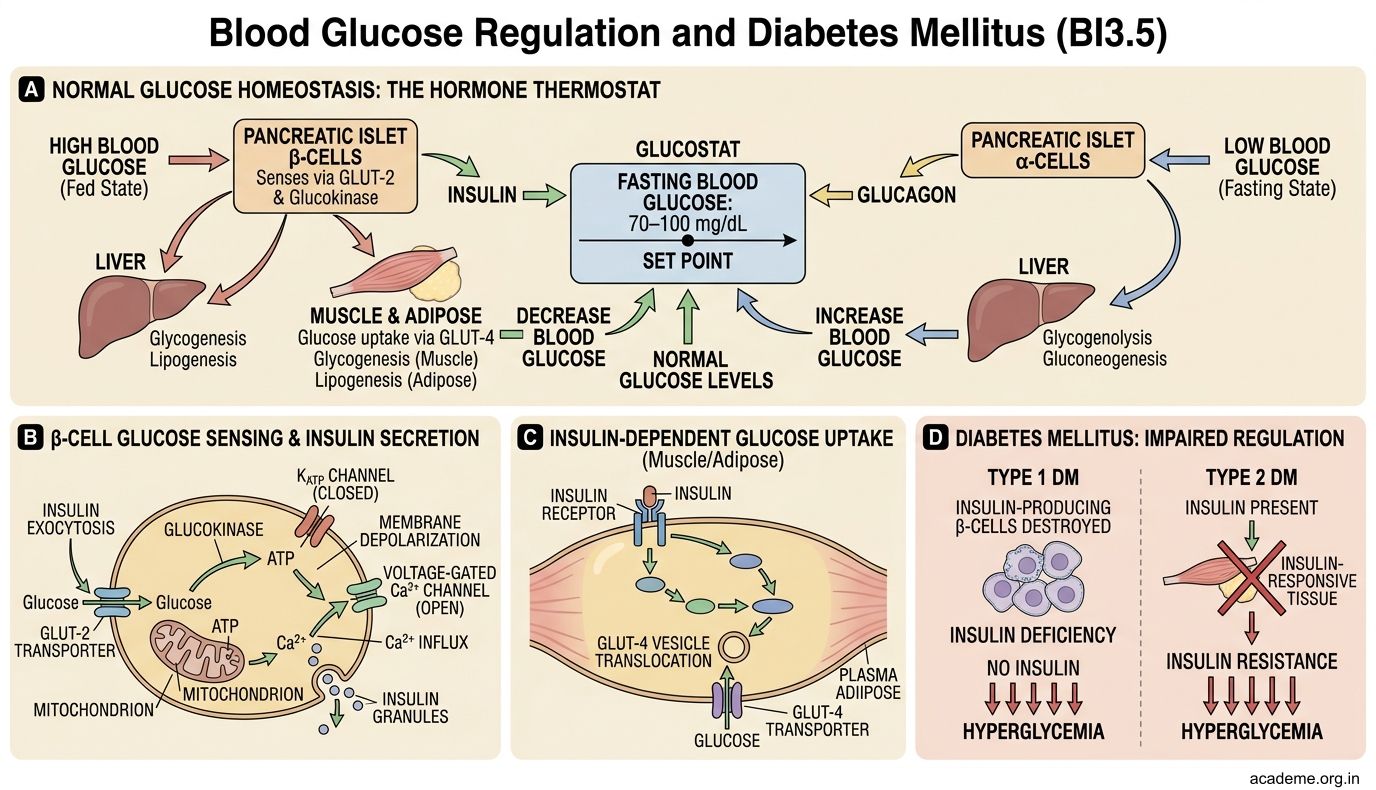
Glucose homeostasis maintains fasting blood glucose at 70–100 mg/dL. This is achieved by two opposing hormones — insulin (lowers glucose) and glucagon (raises glucose) — acting like a thermostat.
After a meal (fed state):
• Blood glucose rises → pancreatic β-cells sense this (via GLUT-2 and glucokinase) → secrete insulin
• Insulin promotes: glucose uptake (GLUT-4 in muscle/fat), glycolysis, glycogenesis, lipogenesis, protein synthesis
• Insulin inhibits: gluconeogenesis, glycogenolysis, lipolysis
• Result: blood glucose returns to normal
During fasting:
• Blood glucose falls → pancreatic α-cells secrete glucagon
• Glucagon promotes: glycogenolysis, gluconeogenesis (in liver)
• Other counter-regulatory hormones also raise glucose: epinephrine, cortisol, growth hormone
• Result: blood glucose maintained for brain function
Diabetes Mellitus — the epidemic:
Type 1 DM (~5-10% of cases):
• Autoimmune destruction of pancreatic β-cells → absolute insulin deficiency
• Onset: usually childhood/adolescence
• Features: polyuria, polydipsia, weight loss, diabetic ketoacidosis (DKA) — because without insulin, fat is broken down to ketone bodies → metabolic acidosis
• Treatment: insulin replacement (lifelong)
Type 2 DM (~90% of cases):
• Insulin resistance + relative insulin deficiency. β-cells initially produce MORE insulin (hyperinsulinaemia) but eventually fail
• Onset: usually adults, associated with obesity, sedentary lifestyle
• Metabolic syndrome: obesity + hypertension + dyslipidaemia + hyperglycaemia
• Treatment: lifestyle modification → metformin → other oral agents → eventually insulin in many patients
Biochemical complications of chronic hyperglycaemia:
1. Non-enzymatic glycosylation (glycation) — glucose attaches to proteins → Advanced Glycation End-products (AGEs) → damage blood vessels → atherosclerosis, nephropathy, retinopathy
2. Polyol pathway activation — excess sorbitol → osmotic damage to lens (cataracts), nerves (neuropathy)
3. Protein Kinase C activation → vascular damage
4. Oxidative stress → endothelial dysfunction
DKA vs Hyperosmolar Hyperglycaemic State (HHS):
• DKA (Type 1): glucose 300-600, ketones HIGH, pH < 7.3, anion gap metabolic acidosis. Emergency: IV fluids + insulin + K⁺ replacement
• HHS (Type 2): glucose > 600, ketones low/absent (enough insulin to prevent lipolysis but not enough for glucose uptake), severe dehydration, altered consciousness. Mortality higher than DKA
Laboratory Investigations in Carbohydrate Disorders (BI3.6)
As a doctor, you'll order and interpret these tests regularly:
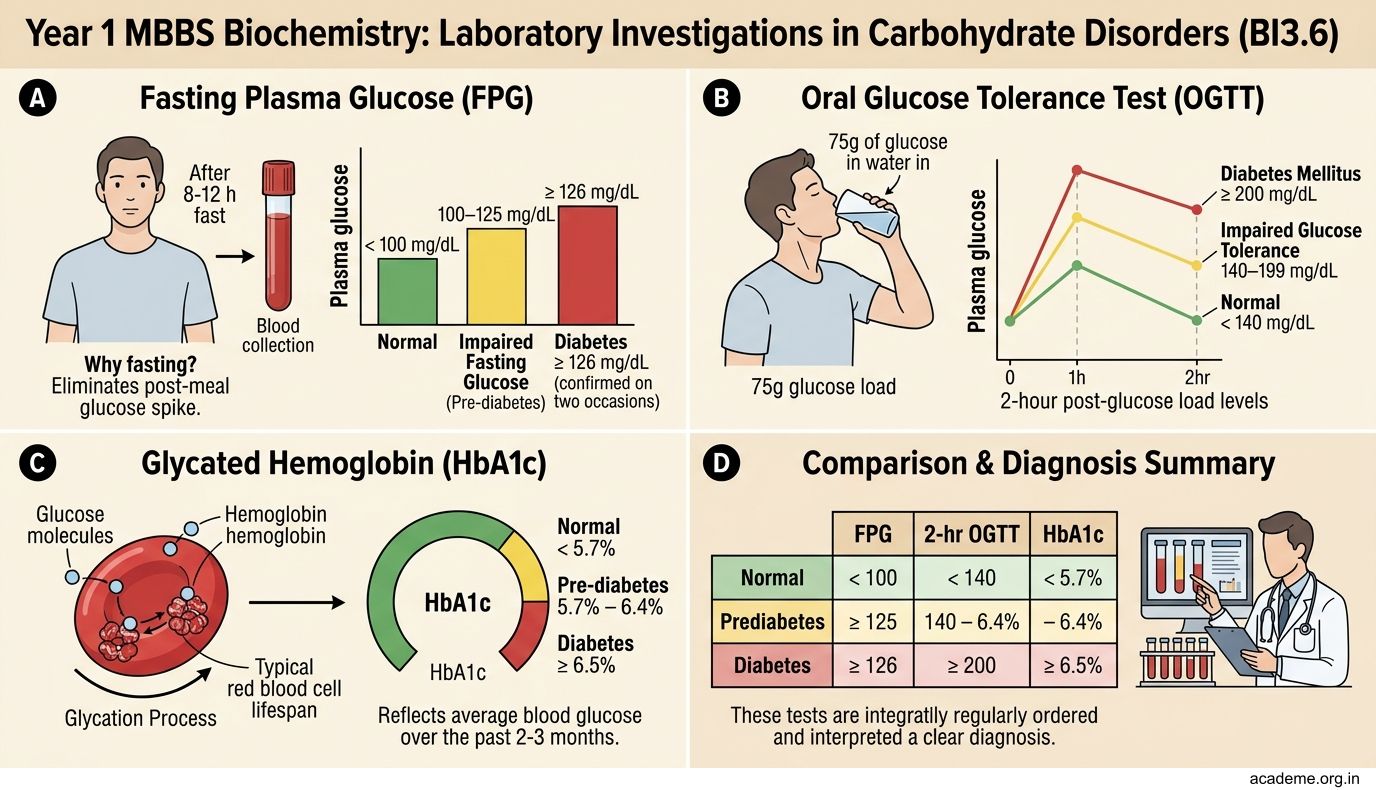
1. Fasting Plasma Glucose (FPG)
• Normal: < 100 mg/dL
• Impaired fasting glucose (pre-diabetes): 100–125 mg/dL
• Diabetes: ≥ 126 mg/dL (confirmed on two occasions)
• Why fasting? Eliminates the post-meal glucose spike. Patient must fast for 8-12 hours.
2. Oral Glucose Tolerance Test (OGTT)
• Patient drinks 75g glucose in water. Blood glucose measured at 0 and 2 hours.
• Normal 2-hour value: < 140 mg/dL
• Impaired glucose tolerance: 140–199 mg/dL
• Diabetes: ≥ 200 mg/dL
• Gold standard for gestational diabetes screening (modified with 100g glucose, measured at 0, 1, 2, 3 hours)
3. HbA1c (Glycated Haemoglobin)
• Measures average blood glucose over the past 2-3 months (lifespan of RBCs)
• Normal: < 5.7%
• Pre-diabetes: 5.7–6.4%
• Diabetes: ≥ 6.5%
• Target for diabetic patients: < 7% (most guidelines)
• Advantage: No fasting required, not affected by day-to-day glucose fluctuations
• Limitation: Unreliable in haemoglobin variants (HbS, HbC), haemolytic anaemia, recent blood transfusion, iron deficiency anaemia
4. Random Plasma Glucose
• ≥ 200 mg/dL with classic symptoms (polyuria, polydipsia, weight loss) = diagnostic of DM
5. Blood Ketones / Urine Ketones
• Elevated in DKA (β-hydroxybutyrate > acetoacetate > acetone)
• Urine dipstick detects acetoacetate (may underestimate severity if β-hydroxybutyrate is predominant)
• Blood β-hydroxybutyrate > 3 mmol/L = significant ketosis
6. Blood Lactate
• Normal: 0.5–1.5 mmol/L. Elevated (> 2 mmol/L) in tissue hypoxia, shock, metformin toxicity, mitochondrial disorders
• Reflects anaerobic glycolysis — when O₂ is insufficient, pyruvate → lactate accumulates
7. Reducing sugar tests (urine)
• Benedict's test — detects any reducing sugar (glucose, galactose, fructose, lactose)
• Glucose oxidase test (dipstick) — specific for glucose only
• If Benedict's positive but glucose oxidase negative → non-glucose reducing sugar → think galactosaemia (galactose) or hereditary fructose intolerance (fructose)
Interpreting results together — a clinical framework:
High fasting glucose + high HbA1c = poorly controlled diabetes. High lactate + low pH = lactic acidosis (check for sepsis, metformin overdose). Positive Benedict's but negative glucose dipstick in a neonate = galactosaemia until proven otherwise.
SELF-CHECK
A 45-year-old obese man with Type 2 diabetes is started on metformin. He presents to the emergency department 3 days later with severe nausea and a blood lactate level of 8 mmol/L. Metformin acts partly by inhibiting which metabolic process in the liver?
A. Glycolysis
B. Glycogenolysis
C. Gluconeogenesis
D. HMP shunt
Reveal Answer
Answer: C. Gluconeogenesis
Metformin inhibits hepatic gluconeogenesis — reducing the liver's glucose output. It also increases peripheral insulin sensitivity. In rare cases (especially in renal impairment), metformin can cause lactic acidosis — lactate cannot be converted to glucose (gluconeogenesis blocked) → accumulates. The elevated lactate in this patient should raise suspicion for metformin-associated lactic acidosis.