Page 4 of 15
CM9.2-3 | CM9.2-3 | Demographic Indices and Sex Ratio — SDL Guide
Learning Objectives
- Define and calculate the major fertility indices: CBR, GFR, TFR, GRR, and NRR, with correct numerators and denominators
- Define and calculate the major mortality indices: CDR, ASDR, IMR, U5MR, and Maternal Mortality Ratio, with India current values
- Define sex ratio and child sex ratio; enumerate causes of the declining child sex ratio in India
- Describe the social and health implications of a skewed sex ratio
- Interpret population pyramids and calculate the dependency ratio
- Apply demographic indices to identify public health priorities
INSTRUCTIONS
Numbers drive decisions in public health — but only if you know exactly what each number measures. A student who cannot state the correct denominator for the Total Fertility Rate will misinterpret a programme's success. A clinician who confuses sex ratio with child sex ratio will misread a district's gender equity challenge. This module builds the numerator-denominator discipline that makes demographic data a precise tool rather than a blunt headline.
References
- Park K. Parks Textbook of Preventive and Social Medicine, 26th ed., Ch. 2 — Demography and Family Planning (textbook)
- Sample Registration System Statistical Report 2020, Registrar General of India (report)
- National Family Health Survey (NFHS-5) 2019-21, Ministry of Health & Family Welfare, India (survey)
- Census of India 2011, Office of the Registrar General and Census Commissioner (report)
Version 2.0 | NMC CBUC 2024
CLINICAL SCENARIO
You are posted as a medical officer in a district of Haryana. The district's child sex ratio — the number of girls per 1,000 boys aged 0-6 years — is 831. The state average is 834. India's Census 2011 average was 919. How did it get this low? What does it mean that there are 169 'missing girls' for every 1,000 boys born in this district? And what are the downstream health consequences — not just the ethical ones, but the measurable, epidemiological ones — of this demographic imbalance? Today's module equips you to answer these questions using the precise language of demographic indices: the numerators, denominators, and multipliers that convert raw vital event counts into comparable, actionable rates.
WHY THIS MATTERS
Demographic indices are the currency of evidence-based community medicine. When the district health officer reports that IMR has fallen from 45 to 28 over five years, that number drives resource allocation, justifies programme continuation, and signals where to invest next. When a state reports a TFR of 2.98 vs. a national TFR of 2.0, that difference indicates where family planning services are most urgently needed. When the child sex ratio falls below 900, it signals not just female foeticide — it predicts future marriage squeeze, higher rates of gender-based violence, trafficking risk, and skewed sex ratios in the adult working-age population two decades later. Mastering these indices is mastering the language in which public health plans are written and funded.
RECALL
From the previous module (Demographic Concepts and Vital Statistics Sources), recall: (1) The Crude Birth Rate (CBR) uses the total midyear population as the denominator. (2) India's SRS 2020 reported CBR ≈ 19.5, CDR ≈ 6.2, and IMR ≈ 28. (3) The NFHS-5 (2019-21) reports the national TFR = 2.0. From your first-year Physiology and Community Medicine orientation, recall: (4) The reproductive age group is conventionally defined as women aged 15-49 years — this is the denominator for fertility rates that correct for age structure. Keep these in mind as we build the full hierarchy of demographic indices.
The Burden of Demographic Imbalance: Declining Sex Ratios and Health
The decline of India's child sex ratio — defined as the number of females per 1,000 males aged 0-6 years — is one of the most alarming demographic trends of the past half-century. The child sex ratio fell from 945 in 1991 to 927 in 2001 and further to 919 in Census 2011. In states such as Haryana (834), Punjab (846), and Rajasthan (883), the deficit is so severe that communities face a fundamental demographic reshaping of their social structure.
The magnitude of the problem becomes clear when we translate these ratios into 'missing girls.' A child sex ratio of 919 means that for every 1,000 boys born in a particular period, approximately 81 girls are 'missing' — either not born due to sex-selective abortion, or killed after birth, or severely undernourished and dying in infancy because of gender-based neglect. Nationally, the cumulative number of missing girls runs into tens of millions over the past four decades.
The health consequences of this demographic distortion cascade across time. In the short term, girls who survive in sex-ratio-skewed communities face higher rates of violence, early marriage, and nutritional deprivation. In the medium term, as the current cohort of 0-6-year-olds reaches adulthood, communities with severe child sex ratio deficits will face a marriage squeeze — an excess of men relative to marriageable women — which international evidence links to increased trafficking of women, rise in dowry-related violence, and elevated rates of non-consensual sexual behaviour. In the long term, communities with low female educational attainment and high son preference perpetuate the fertility-poverty cycle, as maternal education is the strongest single predictor of child survival and fertility decline. Understanding the sex ratio deficit is therefore not only a gender equity concern — it is a public health emergency with multi-decade health sequelae.
Fertility Indices: Measurement and Interpretation
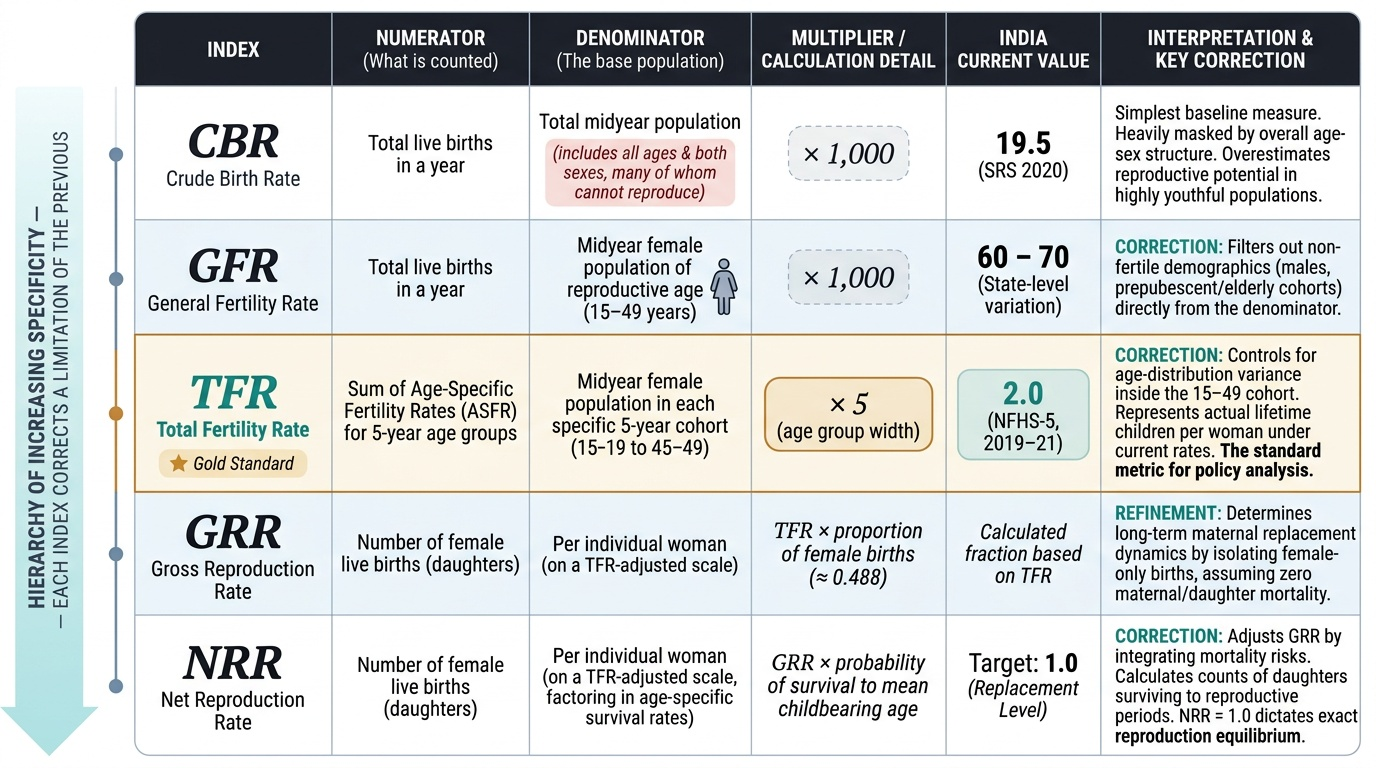
Fertility indices form a hierarchy of increasing specificity. Each successive measure corrects for a limitation of the previous one, making it a more precise tool for understanding fertility patterns and setting programme targets. Understanding this hierarchy — and the reason for each correction — is more important than memorising the formula in isolation.
The Crude Birth Rate (CBR) is the simplest fertility measure: the number of live births per 1,000 midyear total population per year. Its numerator is all live births in a year; its denominator includes all ages and both sexes — the vast majority of whom cannot contribute to births. India's SRS 2020 CBR is approximately 19.5. The adjective 'crude' signals this limitation: the rate is affected by the age-sex structure of the population. A population with a large proportion of elderly persons will have a low CBR even if its women of reproductive age are highly fertile.
The General Fertility Rate (GFR) corrects for the non-fertile population by restricting the denominator to women aged 15-49 years: live births per 1,000 women aged 15-49 per year. This is a more sensitive measure of actual fertility capacity. India's GFR is approximately 60-70 per 1,000 women aged 15-49 (varying by state and year).
The Total Fertility Rate (TFR) goes further: it is the sum of age-specific fertility rates (ASFRs) across all five-year age groups from 15-19 to 45-49, multiplied by 5 (the width of each age group). Conceptually, TFR is the average number of children a woman would have if she experienced current ASFRs throughout her entire reproductive life, assuming no mortality. It is the gold standard fertility index for programme purposes. India's TFR = 2.0 (NFHS-5, 2019-21). Replacement-level TFR in a population with low infant mortality is approximately 2.1 — slightly above 2.0 because some girl children will die before reaching reproductive age.
The Gross Reproduction Rate (GRR) asks: how many daughters would a woman have? GRR = TFR × proportion of births that are female (approximately 0.488 in India). GRR ignores the possibility that some of those daughters might die before they themselves reproduce.
The Net Reproduction Rate (NRR) corrects for this by multiplying GRR by the probability of surviving to the mean age of childbearing. NRR = 1 means each woman is exactly replacing herself — the population is at replacement level. NRR > 1 means population growth; NRR < 1 means population decline. India's NRR is approaching 1, consistent with its TFR of 2.0.
Provided image
SELF-CHECK
A district reports 8,400 live births in a year. The midyear total population is 400,000. The number of women aged 15-49 in the district is 80,000. What is the General Fertility Rate (GFR)?
A. 21 per 1,000 total population
B. 105 per 1,000 women aged 15-49
C. 8.4 per 1,000 women aged 15-49
D. 42 per 1,000 women of reproductive age
Reveal Answer
Answer: B. 105 per 1,000 women aged 15-49
GFR = (live births / midyear women aged 15-49) × 1,000 = (8,400 / 80,000) × 1,000 = 105 per 1,000 women aged 15-49. Option A calculates CBR (8,400 / 400,000 × 1,000 = 21). The key distinction: GFR's denominator is restricted to women aged 15-49 (the reproductive age group), while CBR's denominator includes all ages and both sexes. GFR is therefore a more sensitive indicator of actual fertility capacity in the population.
Mortality Indices: CDR, IMR, and Standardisation
Mortality indices parallel fertility indices in their hierarchy of increasing specificity. The critical skill for a community medicine practitioner is not just knowing the formula, but knowing what each rate is sensitive to — and therefore where it should and should not be used for comparisons.
The Crude Death Rate (CDR) is the number of deaths per 1,000 midyear population per year. India's SRS 2020 CDR is approximately 6.2 — among the lower values in South Asia, reflecting the decline in infectious disease mortality. Like CBR, CDR is affected by age structure: an ageing population (e.g. Japan) will have a higher CDR than a young population, even if age-specific mortality at each age is lower. Comparing CDRs between populations with very different age structures is therefore misleading.
The Age-Specific Death Rate (ASDR) corrects for this by restricting numerator and denominator to the same age group: deaths in age group x per 1,000 persons in age group x. ASDRs reveal which age groups bear the highest mortality burden — in India, the U5 age group and the elderly (65+) are the two peaks.
The Standardised Death Rate (SDR) applies a reference standard population's age structure to the observed ASDRs, producing a rate that is directly comparable across populations with different age structures. Direct and indirect standardisation methods are both used; the principle is to hold age structure constant while varying the mortality rates.
The Infant Mortality Rate (IMR) is the most sensitive and widely used child health indicator: deaths in infants under 1 year of age per 1,000 live births in the same year. India's SRS 2020 IMR is approximately 28 — a dramatic improvement from 129 in 1971, but still far above the SDG target of 12 by 2030. Neonatal mortality (deaths in the first 28 days) contributes approximately 70% of infant deaths in India, pointing to the importance of immediate postnatal care and facility delivery.
The Under-5 Mortality Rate (U5MR) captures all deaths from 0-4 years per 1,000 live births. India's NFHS-5 U5MR is approximately 41.9 per 1,000 live births — the gap between IMR (28) and U5MR (42) represents post-neonatal deaths in the 1-59 month age group, where diarrhoea, pneumonia, and malnutrition are the leading causes.
The Maternal Mortality Ratio (MMRatio) — note: 'ratio' not 'rate,' because the denominator is live births, not the population of women — is the number of maternal deaths per 100,000 live births. India's MMRatio has fallen from 556 in 1990 to approximately 97 per 100,000 live births (SRS 2018-20), one of the steepest declines in the world, driven by the Janani Suraksha Yojana (JSY) and institutional delivery promotion.