Page 5 of 15
CM9.2-3 | CM9.2-3 | Demographic Indices and Sex Ratio — SDL Guide (Part 2)
Sex Ratio, Child Sex Ratio, and Causes of Decline
Two distinct measures are used to quantify gender balance in the Indian population, and they must not be confused. The overall sex ratio — females per 1,000 males across all ages — was 943 in Census 2011. This overall figure is influenced by differential mortality at all ages, selective migration, and historical cohort effects. The child sex ratio — females per 1,000 males specifically in the age group 0-6 years — was 919 in Census 2011. The child sex ratio is a cleaner indicator of sex-selective behaviour at birth and in early infancy, because it is not confounded by decades of differential mortality in adult age groups.
The gap between 943 (overall) and 919 (child) is not a coincidence of arithmetic — it is a signal. In a population without sex selection, the child sex ratio should be approximately 950-952 (reflecting the natural sex ratio at birth of approximately 105 males per 100 females, or 952 females per 1,000 males). The observed child sex ratio of 919, and even lower values in many northern states, represents a systematic and severe deficit of girl children.
The causes of the declining child sex ratio can be organised into proximate and distal factors:
Proximate (direct) causes:
- Female foeticide — sex-selective abortion following prenatal sex determination, made possible by widespread availability of ultrasound technology from the 1980s onward. This is the dominant mechanism in the current era.
- Female infanticide — direct killing or deliberate neglect of female infants, historically practised in certain communities; less prevalent today but not eradicated.
- Differential undernutrition and healthcare — girl children receive less food, immunisation, and medical care than boys in households with strong son preference, contributing to higher post-neonatal female mortality.
Distal (underlying) causes:
- Son preference driven by patrilineal inheritance, the dowry system (where daughters are an economic liability), dependence on sons for old-age support (in the absence of social security systems), and cultural norms that confer social status through male progeny.
- Access to sex-determination technology — cheap portable ultrasound diffused rapidly through India's private healthcare sector, enabling sex-selective abortion even in rural areas.
- Economic pressure — in high-dowry communities, the birth of a daughter is associated with future catastrophic financial obligation, creating incentives for elimination.
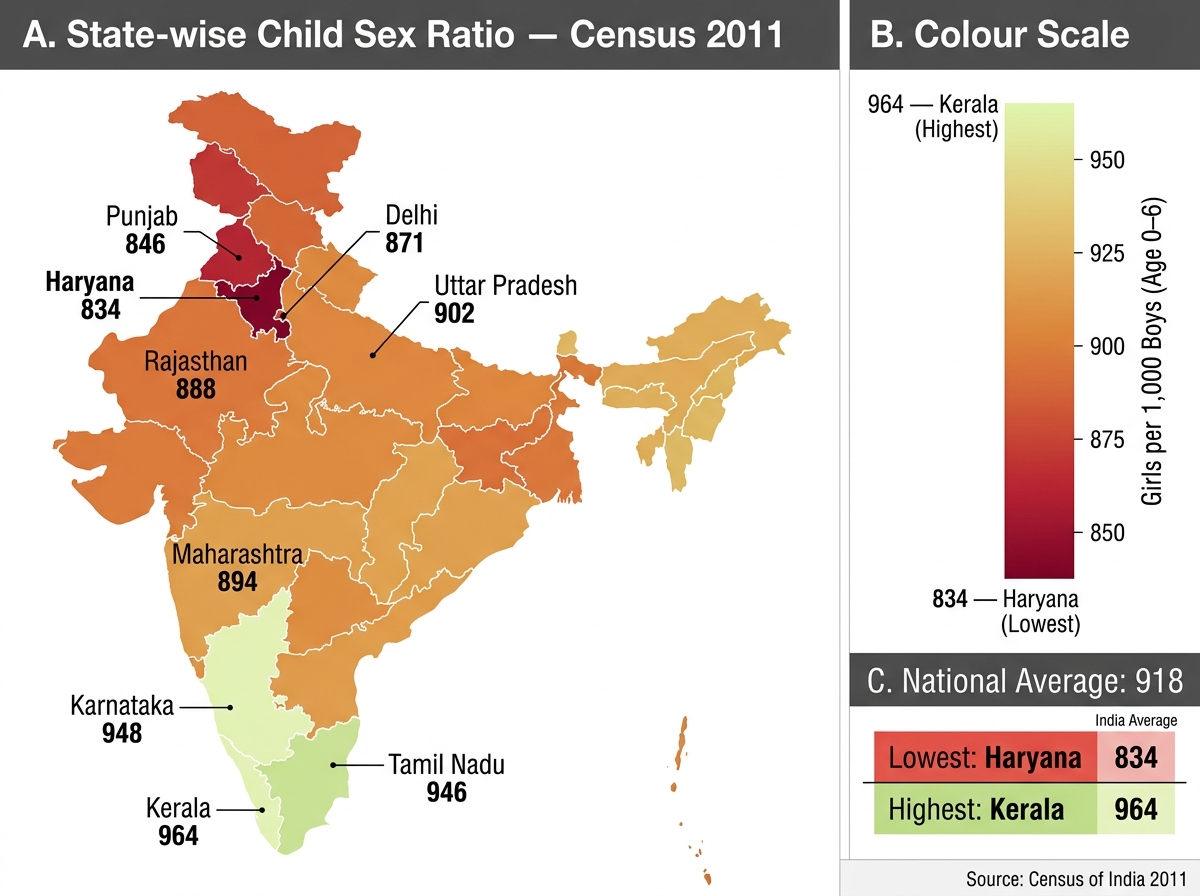
India Child Sex Ratio by State — Census 2011
Population Pyramids and Dependency Ratio
A population pyramid is a graphical representation of a population's age-sex structure: age groups are displayed on the vertical axis (typically in 5-year cohorts), with males on the left and females on the right, and the width of each bar represents the proportion (or number) of that age-sex group. Population pyramids are a powerful visual summary of a community's demographic history, current fertility-mortality balance, and future trajectory.
Reading a population pyramid correctly requires understanding what shape indicates what demographic condition. The shape of the pyramid encodes the community's past fertility decisions (which determine the base) and past mortality (which determines the taper at older ages), as well as any historical disruptions such as wars, famines, or baby booms. More importantly for health planning, the shape predicts future demand: a wide base predicts exploding demand for maternity and child health services; a narrow base with a wide top predicts geriatric service overload. Three canonical shapes correspond to three broad demographic situations, each with distinct health system implications:
- Expansive (or triangular) pyramid — a wide base tapering sharply to the apex. This shape indicates high fertility (many young children) and high mortality at older ages. It is characteristic of populations in the early stages of the demographic transition (Stage 2) — most of sub-Saharan Africa today, and India in the mid-20th century. The broad base predicts continued rapid population growth as the large young cohort ages into reproductive years (population momentum).
- Constrictive (or inverted-triangular/barrel) pyramid — a narrow base with a wider middle and top. This indicates falling fertility (fewer children being born) and low mortality at older ages — characteristic of post-transition societies (Japan, Germany). These populations are ageing: a growing proportion of elderly dependents, a shrinking working-age tax base, and increasing demand for geriatric and social care services.
- Stationary (or columnar/rectangular) pyramid — roughly equal widths at each age group. This indicates replacement-level fertility and low mortality, with a stable (non-growing, non-shrinking) population. It is the theoretical end-state of the demographic transition — achieved by some Scandinavian countries.
India's current national pyramid is transitional between expansive and stationary — broader at younger ages than in stationary populations, but noticeably narrowed at the base compared to 1980. State-level pyramids vary from expansive (Bihar, UP) to near-stationary (Kerala, Tamil Nadu).
The dependency ratio quantifies the economic burden of the non-working population on the working-age population:
Dependency Ratio = [(Population < 15) + (Population ≥ 65)] / (Population 15-64) × 100
A dependency ratio of 50 means 50 dependents for every 100 working-age persons. India's dependency ratio has been falling as the large youth cohort ages into working years — this is precisely the source of the demographic dividend: a transient period when the dependency ratio is low and the working-age fraction is at its maximum, creating optimal conditions for economic growth if accompanied by investment in education, health, and employment.
SELF-CHECK
India's Census 2011 child sex ratio (females per 1,000 males, aged 0-6 years) was 919. The overall sex ratio (all ages) was 943. Which of the following correctly explains why the child sex ratio is lower than the overall sex ratio?
A. Higher female mortality in middle age reduces the overall sex ratio
B. Sex-selective abortion and female infanticide preferentially reduce the proportion of girls at birth and in infancy, making the 0-6 cohort more skewed than older cohorts
C. Migration of adult males to cities reduces the overall sex ratio
D. Girls are underreported in the census because families are reluctant to declare them
Reveal Answer
Answer: B. Sex-selective abortion and female infanticide preferentially reduce the proportion of girls at birth and in infancy, making the 0-6 cohort more skewed than older cohorts
The child sex ratio (0-6 years) reflects the sex ratio at or very shortly after birth — it is least contaminated by decades of differential survival in adult ages. When sex-selective abortion and female infanticide preferentially eliminate girl children, the 0-6 cohort is the most severely skewed. Older cohorts have an overall sex ratio that partially 'corrects' because women outlive men on average (higher male mortality in middle and old age). This is why demographers consider the child sex ratio the most sensitive indicator of active sex selection — its deficit cannot be explained by normal biological mortality differentials.
Interventions Targeting Skewed Sex Ratio
India has responded to the declining child sex ratio with both legislative and programmatic interventions, targeting different points in the causal chain from son preference to sex-selective abortion to postnatal neglect.
The most significant legislative response is the Pre-Conception and Pre-Natal Diagnostic Techniques (PC-PNDT) Act 1994, amended in 2003. The original PNDT Act 1994 prohibited the use of prenatal diagnostic techniques for sex determination. The 2003 amendment extended the prohibition to pre-conception techniques (such as sperm sorting), strengthened penalties (up to three years imprisonment for first offence, five years for subsequent offences), and created a regulatory framework requiring registration of all ultrasound machines and genetic counselling centres. The Act designates Appropriate Authorities at the state, district, and subdistrict levels with powers of inspection, search, and seizure. Implementation remains uneven: lack of trained Appropriate Authorities, under-reporting of violations, and the widespread availability of unregistered portable ultrasound devices undermine enforcement.
The Beti Bachao Beti Padhao (BBBP) programme, launched in 2015, targets the root causes of son preference through a communication campaign promoting the value of girl children, combined with an education incentive scheme. Launched initially in 100 districts with the lowest child sex ratios (including all 22 districts in Haryana, Punjab, and Rajasthan below 880), it has since expanded nationally. Evidence of impact is mixed: some districts report improvements in the child sex ratio and sex ratio at birth; others show limited change, suggesting communication campaigns alone cannot overcome deep-seated economic incentives (the dowry system).
Conditional cash transfer (CCT) schemes target the economic dimension of son preference. Schemes such as the Dhanlakshmi programme and state-specific schemes (Ladli in Haryana, Apni Beti Apna Dhan in Haryana) provide cash transfers tied to milestones — birth registration, immunisation, school enrolment, and avoidance of child marriage — to families with girl children. The economic logic is to reduce the perceived 'cost' of having daughters and to create financial incentives for keeping girls alive and educated.