Page 13 of 21
CM7.6-7 | CM7.6-7 | Screening Tests and Epidemic Investigation — SDL Guide
Learning Objectives
- Enumerate and evaluate the need for screening tests, including criteria for a good screening programme (Wilson-Jungner criteria) (CM7.6)
- Calculate and interpret sensitivity, specificity, positive predictive value, and negative predictive value from a 2×2 table (CM7.6)
- Explain how prevalence affects positive predictive value and the public health implications (CM7.6)
- Describe and demonstrate the steps in the investigation of a communicable disease epidemic (CM7.7)
- Interpret epidemic curves (point-source, propagated, and mixed) and describe principles of outbreak control measures (CM7.7)
INSTRUCTIONS
Screening detects disease before symptoms appear — enabling earlier treatment and potentially saving lives. Epidemic investigation stops disease spread — enabling rapid control of outbreaks that could otherwise become pandemics. Both skills require the same underlying toolkit: a clear case definition, systematic data collection, quantitative test evaluation, and evidence-based action. This module builds fluency in both, with worked calculations and a step-by-step investigation framework applicable to any communicable disease outbreak.
References
- Park's Textbook of Preventive and Social Medicine, 27th edition — Chapter 2: Epidemiology (Screening; Epidemic Investigation) (textbook)
- Wilson JM, Jungner G. Principles and Practice of Screening for Disease. WHO, 1968 (textbook)
Version 2.0 | NMC CBUC 2024
CLINICAL SCENARIO
In 1988, an outbreak of jaundice struck a village in West Bengal. Within two weeks, 47 persons were ill with features of infectious hepatitis. The civil surgeon received the report and immediately dispatched a field investigation team. By interviewing cases and reviewing the village water supply, they identified a single contaminated hand pump used primarily by the affected households. The pump was shut down within 72 hours; within three weeks the outbreak had ended. The investigation took 11 days from first alert to source identification. Had the team not followed a systematic investigation protocol — verifying the diagnosis, formulating a case definition, constructing an epidemic curve, generating a hypothesis, and testing it — the source might never have been found, and the outbreak might have spread to the wider village. This systematic approach is what this module teaches.
WHY THIS MATTERS
India's national health programmes — Universal Immunisation Programme, National Cancer Screening Programme (cervical, breast, oral), national TB elimination programme, antenatal care protocols — all incorporate formal screening procedures with explicitly chosen tests. As a doctor you will order and interpret screening tests daily: Mantoux tests for TB contacts, blood glucose for pre-diabetes, Pap smears for cervical cancer, maternal blood pressure for pre-eclampsia. Understanding how to evaluate a test's performance (sensitivity, specificity, predictive values) is the quantitative skill that prevents you from over-diagnosing using low-specificity tests in low-prevalence populations, or missing true positives with low-sensitivity tests in high-risk groups. Similarly, as a doctor in any setting you are legally and ethically obligated to report and investigate disease clusters — epidemic investigation is a core community medicine competency.
RECALL
From the previous module (CM7.4), recall: (1) A true positive (TP) is a person with the disease who tests positive; a true negative (TN) is a person without the disease who tests negative; a false positive (FP) is a person without disease who tests positive; a false negative (FN) is a person with disease who tests negative. (2) From CM7.2: the chain of infection and modes of transmission underpin epidemic investigation — knowing how a disease spreads determines which hypotheses to test about the source. (3) From CM7.5: case-control design is the analytical tool most commonly used to test an epidemic hypothesis once cases have been enumerated (step 6 of epidemic investigation).
The Population Burden That Drives Screening: Finding Disease Before It Presents
Screening is the presumptive identification of unrecognised disease or defect among apparently healthy individuals by means of tests, examinations, or other procedures that can be applied rapidly. The key word is presumptive — a screening test is not a diagnostic test. A positive screening result requires confirmation by a definitive diagnostic test before treatment is initiated.
The rationale for screening is grounded in the natural history of disease: many diseases have a prolonged subclinical phase (the detectable pre-clinical phase or DPCP) during which they are present but not yet symptomatic. If the DPCP is long and the disease is serious and treatable, early detection during this phase can alter outcome. The classic example is cervical cancer, where the pre-cancerous phase (cervical intraepithelial neoplasia) may last 10–15 years before progression to invasive cancer — a long window for screening to detect and treat.
The burden justification for screening requires that the target disease meet several conditions: it must be a sufficiently serious health problem (high prevalence or severity); effective treatment must exist and be more effective when applied early (lead-time benefit must translate to real outcome benefit, not just earlier diagnosis); and the target population must be accessible and willing to participate. India's population-level screening priorities — cervical cancer (ASHA-delivered VIA), diabetes (opportunistic blood glucose in health and wellness centres), hypertension, and TB (active case finding) — reflect these criteria.
Types of screening: mass screening (entire population), selective (high-risk subgroups — e.g. HIV testing in high-risk groups), opportunistic (incidental testing during clinical encounter — e.g. measuring BP in every outpatient visit), multiphasic (multiple tests in one visit — e.g. national antenatal care protocol testing for anaemia, syphilis, blood group, blood pressure).
Evaluating Screening Tests: Sensitivity, Specificity, and Predictive Values
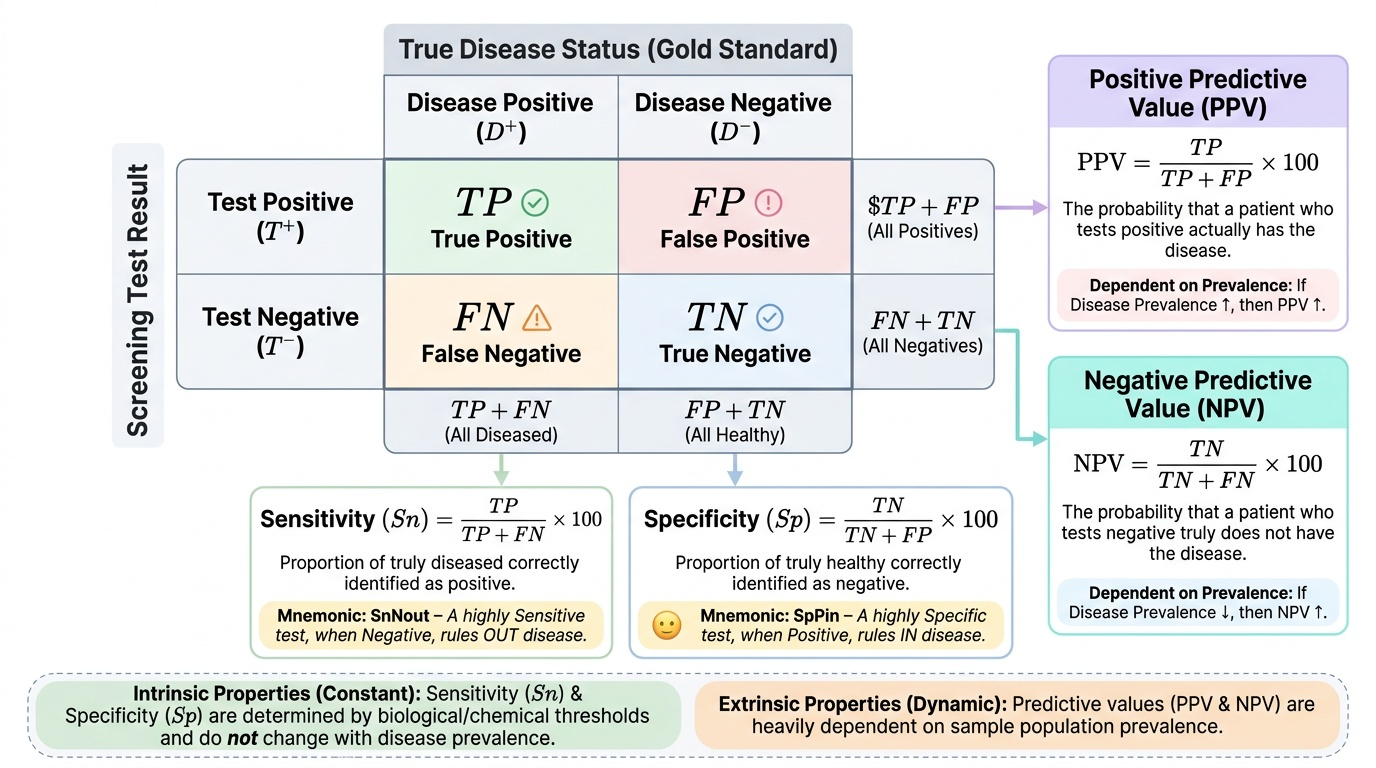
The performance of a screening test is evaluated using a 2×2 contingency table that cross-classifies test results against the true disease status (determined by a gold-standard diagnostic test):
``
                True Disease+    True Disease−
Test Positive:       TP               FP      → TP+FP (all positives)
Test Negative:       FN               TN      → FN+TN (all negatives)
                  TP+FN            FP+TN
Sensitivity (Sn) = TP / (TP + FN) × 100
The proportion of truly diseased persons correctly identified by the test as positive. A high-sensitivity test misses few true cases (few false negatives). When you must not miss disease (serious, treatable disease), maximise sensitivity. Mnemonic: SnNout — a highly Sensitive test, when Negative, rules OUT disease.
Specificity (Sp) = TN / (TN + FP) × 100
The proportion of truly non-diseased persons correctly identified by the test as negative. A high-specificity test produces few false positives. When a positive result will trigger a serious, expensive, or harmful intervention, maximise specificity. Mnemonic: SpPin — a highly Specific test, when Positive, rules IN disease.
Positive Predictive Value (PPV) = TP / (TP + FP) × 100
The probability that a person who tests positive actually has the disease. PPV is the clinically relevant question for a positive result: 'My patient tested positive — how likely is it that they truly have the disease?'
Negative Predictive Value (NPV) = TN / (TN + FN) × 100
The probability that a person who tests negative truly does not have the disease.
Critical relationship: Prevalence affects PPV and NPV — but NOT Sensitivity or Specificity.
Sensitivity and Specificity are intrinsic properties of the test, determined by the test's biological or chemical characteristics and the chosen cut-off point. They do not change with the population's disease prevalence. PPV and NPV, however, depend heavily on prevalence:
- When prevalence is HIGH → PPV increases (fewer false positives relative to true positives) → positive test results are more reassuring.
- When prevalence is LOW → PPV falls dramatically (many false positives relative to few true positives) → even a very sensitive, specific test will yield mostly false positives in a low-prevalence population.
Worked example: A tuberculin skin test has Sn = 95% and Sp = 90%. Applied to 1,000 persons in a high-TB community (prevalence = 10%, i.e. 100 truly infected):
- TP = 95, FN = 5 (5% of 100 true cases missed)
- TN = 810, FP = 90 (10% of 900 uninfected false-positive)
- PPV = 95 / (95+90) × 100 = 95/185 × 100 ≈ 51%
Applied to the same test in a low-TB community (prevalence = 1%, i.e. 10 truly infected per 1,000):
- TP = 9.5, FN = 0.5; TN = 891, FP = 99
- PPV = 9.5 / (9.5+99) × 100 ≈ 8.8%
The test is identical; the community prevalence drives the PPV from 51% to 8.8%. This is why mass screening with a low-specificity test in a low-prevalence population generates massive overdiagnosis and unnecessary investigation.
Provided image
Wilson-Jungner criteria (WHO, 1968): Ten criteria for evaluating whether a disease and test are suitable for a screening programme:
1. The condition should be an important health problem
2. There should be an accepted treatment for patients with recognised disease
3. Facilities for diagnosis and treatment should be available
4. There should be a recognisable latent or early symptomatic stage
5. There should be a suitable screening test
6. The test should be acceptable to the population
7. The natural history of the condition should be adequately understood
8. There should be an agreed policy on whom to treat as patients
9. The cost of case-finding should be economically balanced in relation to possible expenditure on medical care as a whole
10. Case-finding should be a continuing process and not a 'once and for all' project
SELF-CHECK
A new rapid diagnostic test for cervical cancer precursors has sensitivity 90% and specificity 85%. In a high-risk population with a 20% prevalence of precancerous lesions, applied to 1,000 women: TP=180, FP=120, FN=20, TN=680. What is the Positive Predictive Value (PPV)?
A. 90% (sensitivity = PPV in this scenario)
B. 85% (specificity reflects PPV)
C. 60% (180 / 300 × 100)
D. 75% (average of sensitivity and specificity)
Reveal Answer
Answer: C. 60% (180 / 300 × 100)
PPV = TP / (TP + FP) × 100 = 180 / (180 + 120) × 100 = 180/300 × 100 = 60%. Of 300 women with a positive test, 180 truly have precancerous lesions and 120 do not. PPV is distinct from sensitivity (which is 90% = TP / all truly positive = 180/200). The PPV of 60% means that in this high-prevalence (20%) population, 40% of positive results are false positives — still relatively high, but far better than in a low-prevalence population with the same test.
Epidemic Investigation: From Alert to Control
An epidemic occurs when the incidence of a disease in a population exceeds what is normally expected for that place and time. An outbreak is epidemiologically equivalent to an epidemic but is often used for a more localised event. The investigation of an epidemic follows a systematic 10-step procedure, which can be conducted in a modified order depending on the circumstances:
Step 1: Verify the diagnosis — Confirm that cases have the disease suspected (clinical, laboratory, and/or epidemiological evidence). Laboratory confirmation prevents investigating a pseudo-epidemic (artefactual cluster due to changed reporting practices or diagnostic criteria).
Step 2: Confirm the existence of an epidemic — Compare current case counts to the expected baseline (seasonal average from prior years, or control population rates). If a seven-fold excess is confirmed, the epidemic is real.
Step 3: Define the case — A case definition is a set of standard criteria for classifying whether an individual should be counted as a case. It includes: clinical criteria (signs/symptoms); laboratory criteria (test results); epidemiological criteria (time, place, person — e.g. exposure to a specified event). Three levels: confirmed (clinical + laboratory), probable (clinical + epidemiological, no laboratory), suspect (consistent symptoms, no confirmation). Case definitions should be sensitive early in an outbreak (to find all cases) and narrowed as the investigation progresses.
Step 4: Find all cases (case ascertainment) — Actively search for cases beyond those already reported: alert local hospitals, review laboratory records, conduct community surveys. Calculate the attack rate for the outbreak (cases / exposed population × 100).
Step 5: Describe distribution by time, place, and person — Construct an epidemic curve (cases on Y-axis, date/time of onset on X-axis). The shape of the epidemic curve is diagnostically powerful:
- Point-source epidemic (common source, brief exposure): rapid rise, bell-shaped peak, rapid fall; the entire epidemic spans ≤1 incubation period; all cases were exposed at approximately the same time (e.g. food-poisoning at a wedding).
- Propagated (continuing source/person-to-person) epidemic: gradual rise, multiple irregular peaks, each peak approximately one incubation period apart (e.g. measles spreading through a school).
- Mixed epidemic: point-source outbreak followed by person-to-person spread (e.g. index case introduced pathogen, who then transmitted to contacts — typhoid with secondary cases).
Draw a spot map to show geographical clustering. Describe person characteristics (age, sex, occupation, immunisation status).
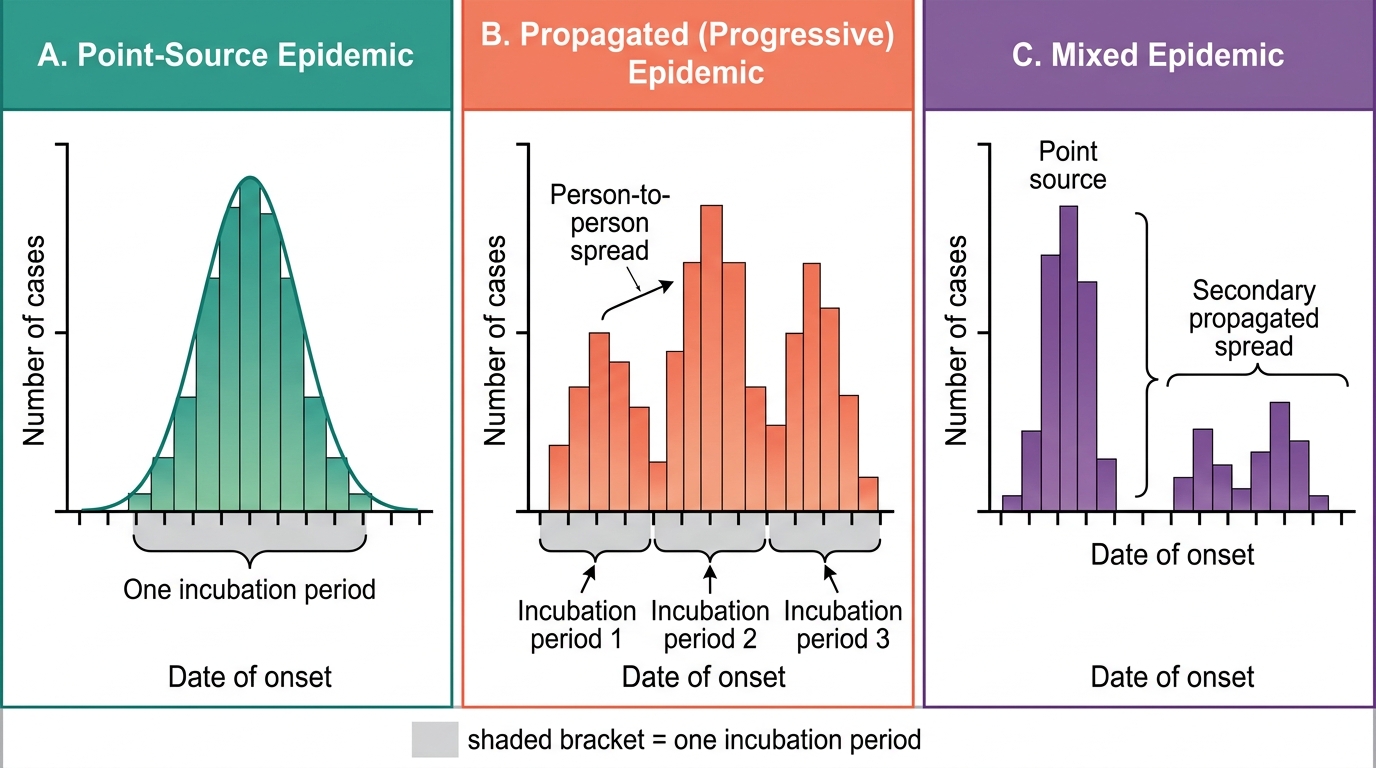
Types of Epidemic Curves
Step 6: Hypothesise source and mode of transmission — Based on the epidemic curve shape, the spot map, and person distribution, formulate hypotheses about the source and mode: Was it water? Food? Person-to-person? A specific event?
Step 7: Test the hypothesis — Design and execute an analytical study (usually a case-control or retrospective cohort study) comparing exposure histories of cases and controls. Calculate attack rates for different exposure categories; compute Relative Risk or Odds Ratio. A significantly elevated OR for consumption of a specific food item at a common meal, for example, confirms food as the vehicle.
Steps 8–10: Implement control measures, evaluate effectiveness, communicate findings — Control measures (described in detail in the next section) are implemented in parallel with investigation, not after it. Effectiveness is monitored by tracking new cases via the epidemic curve. A final outbreak investigation report is written and disseminated to health authorities.
SELF-CHECK
During an outbreak of gastroenteritis at a school canteen, you plot the epidemic curve and find a single sharp peak with all cases onset within 12 hours, spanning a total of 18 hours. The typical incubation period of the suspected pathogen is 1–6 hours. What type of epidemic curve does this represent and what does it suggest about the source?
A. Propagated epidemic — person-to-person spread at school
B. Mixed epidemic — initial point-source with secondary spread
C. Point-source epidemic — all cases exposed to a common source at approximately the same time
D. Endemic epidemic — ongoing low-level transmission in the community
Reveal Answer
Answer: C. Point-source epidemic — all cases exposed to a common source at approximately the same time
A point-source epidemic produces a sharp bell-shaped curve with all cases occurring within approximately one incubation period (here 1–6 hours), consistent with simultaneous exposure to a common contaminated source (most likely a specific food item in the canteen). The 18-hour total span is within the expected range for the pathogen. A propagated epidemic would show multiple peaks each separated by approximately one incubation period; a mixed epidemic would show an initial peak followed by secondary cases at a later interval.
Epidemic Control Measures and Communication
Control measures are implemented while the investigation is ongoing — they should not wait for complete analytical confirmation if the delay would allow further spread. Control measures are organised by the link in the transmission chain they target (reflecting CM7.2).
Source control: Remove or eliminate the contaminated vehicle (discard implicated food, close contaminated water supply, treat or isolate infectious cases). In the food-borne outbreak scenario, identifying and removing the implicated food from the canteen is the first control action — performed even before case-control results confirm which item was responsible.
Interrupting transmission: Disinfect water supply (hyperchlorination), enforce handwashing and food hygiene, implement infection control precautions in hospitals (standard and transmission-based precautions), trace and test contacts.
Protecting the susceptible host: Emergency mass vaccination during measles outbreaks; antibiotic prophylaxis for close contacts of meningococcal disease; passive immunisation (immunoglobulins) for post-exposure hepatitis A prophylaxis in close contacts.
Evaluating effectiveness of control: Plot a rolling epidemic curve during the response phase. If control is effective, new cases should decline and the curve should fall. If new cases cluster around a different source (a second wave), the investigation and control must be extended.
Risk communication: Public health authorities must communicate with multiple audiences simultaneously: affected communities (what to do, what to eat/drink, when to seek care), media (accurate, non-alarmist messaging), political authorities (resource needs, legal authorities for quarantine), and the clinical community (case definitions, treatment protocols, notification procedures). The WHO risk communication framework emphasises: Be first, be right, be credible, be empathetic.
Outbreak investigation report: The formal written report follows an IMRAD-like structure (Introduction/Background, Methods/Case definition, Findings/Epidemiological analysis, Discussion/Control measures, Recommendations). It is submitted to the district/state health authority and to IDSP for national surveillance purposes.
CLINICAL PEARL
PPV falls dramatically in low-prevalence settings — even with excellent tests. The most counter-intuitive result in screening epidemiology: a test with 99% sensitivity AND 99% specificity applied to a population with 0.1% prevalence of disease gives a PPV of approximately 9% — meaning 91% of all positive tests are false positives. This is why TB contact tracing (a high-prevalence group) justifies the Mantoux test while screening the general public (low prevalence) generates massive over-referral. When you order a screening test, always ask: 'What is the pre-test probability (prevalence) in this patient or population?' — it determines whether a positive result is clinically meaningful.
SELF-CHECK
You are investigating a cholera outbreak and suspect the source is a contaminated water supply. Which analytical study design is MOST appropriate to test this hypothesis?
A. Randomised controlled trial — randomly assign some households to the contaminated supply
B. Cross-sectional survey — measure both water source exposure and cholera disease status simultaneously
C. Retrospective cohort or case-control study — compare water exposure between ill and non-ill community members
D. Ecological study — compare cholera rates between districts with different water supply quality
Reveal Answer
Answer: C. Retrospective cohort or case-control study — compare water exposure between ill and non-ill community members
A retrospective cohort study (if the entire exposed population can be identified) or case-control study (if the exposed population is large or unknown) is the appropriate analytical design for hypothesis testing in outbreak investigation (Step 7). You compare the proportion of cases who used the suspected water source to the proportion of non-cases (controls) who did so, computing the Odds Ratio or Attack Rate Ratio. An RCT is unethical (cannot randomise exposure to a contaminated supply). Cross-sectional survey has temporality limitations. An ecological study uses aggregate data and cannot link individual exposure to individual disease.
KEY TAKEAWAYS
Screening uses tests applied to asymptomatic populations to detect disease early. Test performance is characterised by Sensitivity (TP / (TP+FN) × 100 — ability to detect true cases), Specificity (TN / (TN+FP) × 100 — ability to rule out non-cases), PPV (TP / (TP+FP) × 100 — probability disease is present given a positive test), and NPV (TN / (TN+FN) × 100 — probability disease is absent given a negative test). Sensitivity and Specificity are test properties and do not change with prevalence; PPV falls in low-prevalence populations even with good tests. The Wilson-Jungner criteria (10 criteria, WHO 1968) guide which diseases and tests merit a screening programme. Epidemic investigation follows a 10-step protocol: verify diagnosis, confirm epidemic, define case, find cases, describe (time/place/person), hypothesise, test hypothesis (case-control or cohort design), implement control, evaluate, and communicate. Epidemic curves reveal transmission type: point-source = single bell-shaped peak ≤1 incubation period; propagated = multiple irregular peaks each ~1 incubation period apart; mixed = point-source followed by person-to-person spread. Control targets the relevant chain-of-infection link.
REFLECT
You are posted in a rural primary health centre. A new rapid blood-glucose test has been proposed for diabetes screening of all adults attending the PHC, regardless of symptoms or risk factors. The test has sensitivity 85% and specificity 80%. The background prevalence of undiagnosed diabetes in your PHC catchment area is estimated at 3%. (a) Without calculating exact numbers, predict qualitatively whether the PPV will be high or low in this setting and explain why. (b) What change in the target population — shifting from all adults to only adults over 45 with a family history of diabetes — would do to the PPV and why? (c) Would you recommend implementing this screening programme as proposed? Justify your answer using at least two of the Wilson-Jungner criteria. Write four to five sentences.