Page 14 of 21
CM7.9-11 | CM7.9-11 | Digital Epidemiology and Research Appraisal — SDL Guide
Learning Objectives
- Describe and demonstrate the application of computers in epidemiology — including GIS, electronic surveillance systems, and digital data sources (CM7.9)
- Demonstrate development of an epidemiological research proposal, including problem formulation, objectives, hypothesis, study design, sampling plan, data analysis, and ethical considerations (CM7.10)
- Demonstrate skills for critically appraising research articles or data — evaluating validity, results, and applicability (CM7.11)
INSTRUCTIONS
In the 21st century, epidemiological data flows not just from hospitals and registries but from mobile phones, social media platforms, electronic health records, and satellite imagery. The ability to use these new data sources intelligently — and to critically evaluate research articles that are increasingly generated from them — is an essential competency for the modern community medicine practitioner. This module builds digital epidemiology literacy, teaches the architecture of a research proposal, and equips you with a systematic three-part framework for critical appraisal.
References
- Park's Textbook of Preventive and Social Medicine, 27th edition — Chapter 2: Epidemiology; Chapter 3: Research Methods in Community Medicine (textbook)
- Gordis L. Epidemiology, 5th edition — Chapter 18: Epidemiology and Medicine: The Evidence Base for Clinical Practice (textbook)
Version 2.0 | NMC CBUC 2024
CLINICAL SCENARIO
In early 2020, weeks before COVID-19 was officially declared a pandemic, researchers at the BlueDot analytics company had already flagged the Wuhan pneumonia cluster to their clients — using an algorithm that scanned airline ticketing data, animal disease alerts, and news reports in 65 languages simultaneously. They had issued the warning on 31 December 2019, the same day China notified the WHO but nine days before the WHO's public statement. Their tool was not a traditional epidemiological survey or a clinical study — it was a digital epidemiology system that harvested and synthesised non-traditional data streams in real time. This is the frontier at which epidemiology now operates, and understanding it — and knowing how to critically evaluate the evidence it generates — is what this module builds.
WHY THIS MATTERS
As a Year-2 student moving toward clinical rotations and, eventually, community medicine postings, you will encounter research articles daily: in grand rounds, journal clubs, continuing medical education programmes, and clinical practice guidelines. The ability to read a paper and ask the right critical questions — Was the design appropriate? Were biases controlled? Does the effect size matter clinically? Can I apply these findings to my patients? — distinguishes an evidence-based practitioner from one who acts on authority or habit. Additionally, as a future medical officer or community medicine specialist, you will need to formulate and submit research proposals for state health programmes, clinical audits, and community health assessments. This module provides both skills.
RECALL
From CM7.5 and CM7.8: (1) Epidemiological study designs (cohort → Relative Risk; case-control → Odds Ratio; cross-sectional → prevalence ratio) underpin critical appraisal — you cannot appraise a study without knowing what its design implies. (2) The major biases (selection, information, confounding) are the primary threats to validity that a critical appraisal must assess. (3) From CM7.3: traditional data sources (CRS, SRS, NFHS, IDSP) form the core of India's surveillance infrastructure; digital epidemiology extends this with new data streams that have distinct strengths and limitations.
The Digital Transformation of Epidemiology: New Data, New Challenges
Traditional epidemiology relied on data collected through labour-intensive field surveys, disease notifications, and vital registration systems — all of which involve significant time delay and geographic gaps. Digital epidemiology (sometimes called 'infodemiological epidemiology' or 'big data epidemiology') leverages the massive volumes of passively generated digital data to complement and in some cases replace traditional surveillance.
The key innovation is passivity: while a case notification requires a healthcare worker to actively file a report, a social media post, a search query, or a GPS trace is generated spontaneously by the user as part of their normal behaviour. This passivity enables near-real-time monitoring at scales impossible with active surveillance.
However, digital epidemiology introduces new challenges that traditional epidemiology does not face:
- Representativeness bias: digital data reflect the users of digital platforms — typically younger, urban, educated, and connected — not the full population. India's rural populations, who bear a disproportionate burden of infectious disease, are underrepresented in social media data.
- Confounding by digital behaviour: search volumes for a disease term spike during media coverage, not just during true outbreaks. Google Flu Trends (2008-2015) famously overestimated influenza incidence by 2× in some periods because flu-related news coverage drove search volumes independently of actual disease burden.
- Data quality and validation: traditional data systems have explicit collection protocols and quality checks; digital data require novel validation frameworks.
- Privacy and ethics: linking GPS traces, health records, and social media data raises significant individual privacy concerns (India's Personal Data Protection landscape is rapidly evolving).
Despite these challenges, digital epidemiology has demonstrably improved outbreak detection speed, geographic precision, and real-time monitoring capability — and will continue to grow in importance as India's digital health infrastructure (Ayushman Bharat Digital Mission, CoWIN, IDSP e-reporting) expands.
Applications of Computers in Epidemiology: GIS, Surveillance, and Big Data
Specific applications of computers and digital systems in epidemiology can be grouped into five categories.
1. Disease Mapping and Geographic Information Systems (GIS):
GIS software links epidemiological data (case counts, incidence rates, risk factor prevalence) to geographic maps, enabling spatial visualisation and analysis. Applications include: identifying geographic clusters of disease (spatial clustering around a contaminated water source); mapping mosquito breeding sites relative to malaria case density; tracking the geographic spread of an epidemic in real time. India's NVBDCP (National Vector-Borne Disease Control Programme) uses GIS for malaria stratification to target indoor residual spraying (IRS) to high-burden areas. The John Snow cholera spot map (1854) is the historical precursor; modern GIS systems add statistical power (spatial scan statistics to detect non-random clustering).
2. Electronic Health Records (EHR) and Health Information Systems:
Digitised clinical records allow retrospective cohort studies using routinely collected data (pharmacoepidemiology, adverse event detection) and real-time monitoring of disease trends. India's Integrated Health Information Platform (IHIP, the next-generation IDSP reporting system) digitises case reporting from subcentre to national level, enabling faster response. Nikshay, the TB case-notification platform, links patient registration, treatment status, and outcomes electronically.
3. Participatory Digital Surveillance:
Platforms that allow citizens to self-report symptoms or potential exposures: India's Aarogya Setu app during COVID-19 collected symptom data from over 150 million users; global platforms like ProMED, HealthMap, and GPHIN aggregate open-source media and laboratory reports for early outbreak detection. The COVID-19 pandemic accelerated the development of digital contact tracing systems across all Indian states.
4. Internet and Social Media Data Mining:
Google search trends for specific disease terms (fever, jaundice, dengue symptoms) have been used to nowcast disease incidence weeks before official reports. Twitter (X) mining has been used to track pandemic sentiment and identify vaccine hesitancy geographies. Limitations: representativeness bias, confounding by media coverage.
5. Statistical and Modelling Software:
Epidemiological analysis requires dedicated statistical packages: R (open source, widely used for epidemiological modelling), SPSS, Stata, OpenEpi (free, web-based, designed for epidemiologists — used in field investigations). Infectious disease modelling uses compartmental models (SIR — Susceptible, Infectious, Recovered) to project epidemic trajectories and evaluate intervention scenarios.
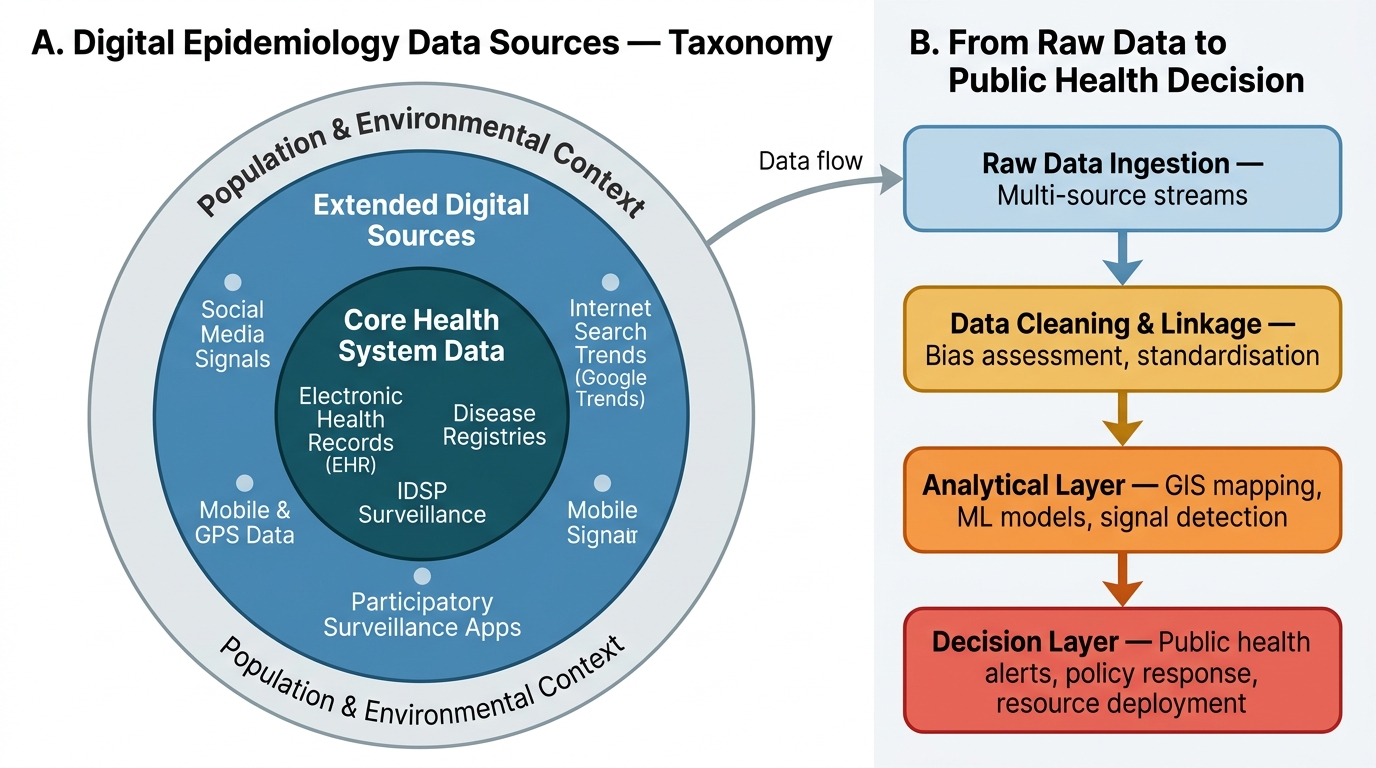
Digital Epidemiology: Data Source Taxonomy and Decision Pipeline
SELF-CHECK
A health researcher uses mobile phone GPS data from a telecom company to track population movement during a dengue outbreak, aiming to map disease spread in real time. What is the PRIMARY limitation of this digital epidemiology approach?
A. GPS data cannot be linked to disease status at the individual level
B. The data are only available after a significant time delay
C. Mobile phone users may not be representative of the full population, particularly the poorest, oldest, and most rural residents
D. GIS software cannot process GPS data for public health analysis
Reveal Answer
Answer: C. Mobile phone users may not be representative of the full population, particularly the poorest, oldest, and most rural residents
The primary limitation of using mobile phone GPS data is representativeness bias: mobile phone users — and smartphone GPS data in particular — are systematically skewed toward younger, urban, educated, and more affluent segments of the population. The poorest, oldest, and most rural residents (who may bear the highest dengue burden in some contexts) are systematically under-represented. GIS software can indeed process GPS data; the time delay issue is less severe for GPS data than for traditional surveillance; and GPS data can be linked to disease outcomes in aggregate (not individual) analyses.
Developing an Epidemiological Research Proposal
A research proposal is a detailed plan submitted to an ethics committee, funding agency, or institution that justifies why a study should be done and explains how it will be conducted. The ability to write a coherent proposal is required for MBBS-level community medicine postings, community health projects, and postgraduate research. The standard components are:
Title: Concise (≤15 words), descriptive — typically of the form 'Prevalence of [outcome] among [population] in [setting], [year]' or 'Risk factors for [outcome]: a case-control study in [setting]'.
Introduction and Background: Establishes the public health importance of the problem — burden (prevalence, incidence, mortality), current knowledge gaps, and why this study is needed now in this setting. Cites the relevant literature.
Objectives: Separated into a general objective (the broad aim — 'to determine the prevalence of hypertension among adults in urban slums of Chennai') and specific objectives (each answering one research question — 'to estimate the prevalence by sex and age group', 'to identify associated risk factors'). Each specific objective should be answerable from the study's data.
Hypothesis: The research hypothesis (alternative hypothesis, H₁) states the expected direction of the association (e.g. 'tobacco use is associated with a higher risk of oral cancer'). The null hypothesis (H₀) states no association. Statistical tests evaluate the probability of observing the data if H₀ is true (the p-value).
Study Design and Setting: State the design (cross-sectional, case-control, cohort), study setting (district, institution, community), and rationale for the design choice.
Study Population and Sampling: Inclusion and exclusion criteria for participants; sampling method (simple random, stratified, cluster, systematic, purposive); sample size calculation — a formula based on expected prevalence (or expected effect size for analytical studies), desired confidence level (typically 95%), acceptable error (typically 5–10%), and design effect (for complex survey designs). Sample size must be justified — an underpowered study is ethically unjustifiable (exposes participants to research without prospect of valid results).
Data Collection: Instruments (validated questionnaire, physical examination, laboratory tests); training of data collectors; piloting the questionnaire; data quality assurance.
Data Analysis Plan: For descriptive studies: proportions, means, confidence intervals. For analytical studies: measures of association (RR, OR, prevalence ratio), confidence intervals, and p-values; multivariate analysis for confounding control; software to be used (SPSS, R, OpenEpi).
Ethical Considerations: Every research proposal submitted to an Institutional Ethics Committee (IEC) must address: informed consent procedure, confidentiality protection, anticipated risks and benefits, data storage, and whether vulnerable populations are involved. India's ICMR Ethical Guidelines for Biomedical Research (2017, updated 2022) are the governing framework.
Budget and Timeline: Detailed budget justifying costs; Gantt chart or milestone-based timeline spanning from preparation through data collection, analysis, and dissemination.
SELF-CHECK
A researcher formulates the following research objective: 'To study the relationship between stress and hypertension.' What is the PRIMARY problem with this objective?
A. It does not specify the study design
B. It is too broad, lacks operational specificity about the population, setting, and measurement approach
C. It does not include a null hypothesis
D. It uses the word 'relationship' instead of 'association'
Reveal Answer
Answer: B. It is too broad, lacks operational specificity about the population, setting, and measurement approach
The objective is too broad and non-operational: it does not specify which population (age, sex, occupational group?), which setting (urban/rural, India?), how stress will be measured (validated scale? perceived stress score?), what hypertension definition will be used (cutoff? existing diagnosis?), or over what time period. A well-formulated specific objective states all these elements so it can be directly answered by the study's data. Study design and hypothesis are separate sections; the word 'relationship' vs 'association' is a minor stylistic issue, not the primary problem.