Page 15 of 21
CM7.9-11 | CM7.9-11 | Digital Epidemiology and Research Appraisal — SDL Guide (Part 2)
Critical Appraisal of Research Articles
Critical appraisal is the systematic evaluation of a research paper's design, conduct, analysis, and conclusions to determine whether the findings are valid, important, and applicable. It is NOT finding fault for its own sake — it is assessing whether a study's conclusions can be trusted and used to guide practice or policy.
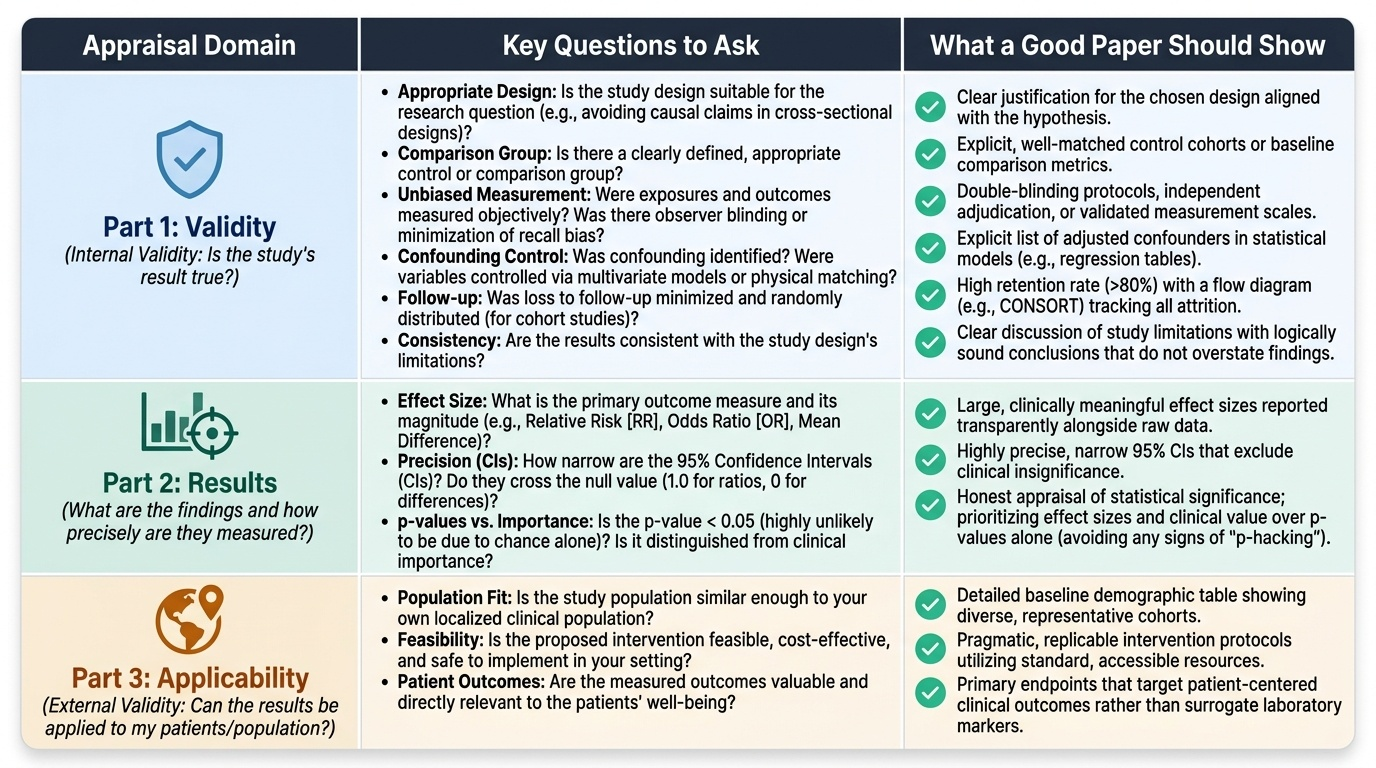
The three-part appraisal framework (adapted from the Oxford Centre for Evidence-Based Medicine) addresses:
Part 1 — Validity (internal validity): Is this study's result true?
- Is the study design appropriate for the research question? (A cross-sectional study cannot prove causation — CM7.5)
- Is there a clearly defined, appropriate comparison group?
- Was measurement of exposure and outcome unbiased? (How was recall bias minimised in a case-control study? Was the observer blinded in a clinical trial?)
- Was confounding identified and controlled? (What variables were included in the multivariate model? Are important confounders missing?)
- Was loss to follow-up minimised and randomly distributed? (For cohort studies)
- Are the results consistent with the study design's limitations?
Part 2 — Results: What are the findings and how precisely are they measured?
- What is the primary outcome measure and what is its effect size (RR, OR, mean difference)? Is the effect size clinically meaningful?
- What are the confidence intervals (CIs)? A 95% CI that does NOT cross 1.0 (for ratios) or 0 (for differences) is statistically significant at p<0.05. A narrow CI = high precision (large sample); a wide CI = low precision (small sample).
- What is the p-value? A p-value <0.05 means the result is unlikely to be due to chance alone if the null hypothesis were true — but it does NOT mean the effect is clinically important. A study of 100,000 persons can detect a statistically significant but clinically meaningless RR of 1.01.
- Distinguish statistical significance from clinical significance: always inspect the effect size and CI, not just the p-value.
Part 3 — Applicability (external validity): Can the results be applied to my patients/population?
- Is my population similar enough to the study population that the results could apply? (A study conducted only in men may not apply to women.)
- Is the exposure (intervention) feasible to implement in my setting?
- Are the outcomes measured the ones that matter to my population (patient-centred outcomes vs surrogate markers)?
- What is the absolute benefit (Number Needed to Treat or Number Needed to Harm) compared to the relative benefit?
Standardised reporting checklists help assess completeness of study reporting: CONSORT (Consolidated Standards of Reporting Trials) for RCTs; STROBE (Strengthening the Reporting of Observational Studies in Epidemiology) for cohort, case-control, and cross-sectional studies; PRISMA for systematic reviews and meta-analyses.
Provided image
CLINICAL PEARL
A statistically significant result is not the same as a clinically important one. The p-value tells you the probability that the observed result (or more extreme) could arise by chance if the null hypothesis is true. With a very large sample size, even trivially small differences become statistically significant. A study of 200,000 persons might find that a new supplement reduces systolic blood pressure by 0.5 mmHg with p=0.001 — statistically significant, but clinically meaningless (this change is smaller than measurement error). Always examine the effect size (RR, OR, mean difference) and its 95% CI before declaring a result important. Conversely, a small study may fail to reach statistical significance not because no effect exists but because the sample is underpowered — a non-significant result does not prove no effect. This is why sample size calculation is mandatory before data collection.
SELF-CHECK
A cohort study finds that a new dietary supplement reduces cardiovascular events with RR=0.95 (95% CI: 0.87–1.03, p=0.21). How should this result be interpreted?
A. The supplement significantly reduces cardiovascular risk because RR<1.0
B. The result is statistically significant because RR does not equal 1.0
C. The result is not statistically significant (CI crosses 1.0) and the observed protective effect may be due to chance
D. The wide CI proves the study is invalid
Reveal Answer
Answer: C. The result is not statistically significant (CI crosses 1.0) and the observed protective effect may be due to chance
The 95% CI (0.87–1.03) crosses 1.0, which means the association is not statistically significant at p<0.05 — consistent with the p-value of 0.21. An RR <1.0 alone does not establish a statistically significant protective effect; the CI must exclude 1.0. The result is consistent with no true effect (RR=1.0 is within the CI). However, the wide CI spanning from a 13% reduction to a 3% increase suggests the study may be underpowered — a larger study might find a significant effect or definitively rule one out. A wide CI reflects imprecision, not necessarily invalidity.
From Evidence to Action: Applying Appraisal Skills in Indian Practice
The synthesis of digital epidemiology, research proposal skills, and critical appraisal comes together in a practical scenario: how does a community medicine specialist in India convert available evidence into a programme decision?
Consider a district medical officer who reads a paper: 'A prospective cohort study of 5,000 adults in Maharashtra found that those who walked ≥30 minutes daily had a 25% lower incidence of Type 2 diabetes over 5 years (RR=0.75, 95% CI: 0.65–0.87) after adjusting for age, BMI, and diet.'
Applying the three-part appraisal:
Validity: The prospective cohort design establishes temporality (walking assessed before diabetes onset). Confounding was controlled by multivariate adjustment for age, BMI, and diet — but occupation, socioeconomic status, and baseline fasting glucose are not mentioned. These are plausible confounders (more affluent persons walk more AND have lower diabetes risk from better healthcare). Measurement of walking was presumably self-reported — recall may be inaccurate. Overall: moderate internal validity, confounding not fully controlled.
Results: RR=0.75 means a 25% relative risk reduction. The 95% CI (0.65–0.87) does not cross 1.0 — statistically significant. A 25% reduction is clinically meaningful for a common, costly disease. However: what is the baseline incidence? If diabetes incidence in the cohort is 2% over 5 years, a 25% relative reduction translates to an absolute risk reduction of 0.5% (NNT ≈ 200 over 5 years) — modest absolute benefit. If baseline incidence is 10%, absolute reduction is 2.5% (NNT ≈ 40) — larger benefit.
Applicability: Maharashtra is broadly comparable to other Indian states, but urban vs rural setting matters. Walking infrastructure, local diet patterns, and diabetes baseline prevalence may differ in the officer's district. The intervention (walking ≥30 minutes daily) is low-cost and feasible. The outcome (incident diabetes) is patient-relevant.
Decision: The evidence supports recommending daily walking as part of primary prevention — but the officer should seek local prevalence data to estimate the absolute benefit in their district and design a community health programme with walking promotion integrated into antenatal care, school health, and primary healthcare contacts.
Digital tools in this decision: India's Ayushman Bharat Health Account linked to Aarogya Setu data could theoretically be used to track NCD risk factors in the officer's district in real time. IHIP data could provide local diabetes incidence estimates. A community-level survey using REDCap (open-source data capture tool) could generate local prevalence data to inform the programme design. Research appraisal skills made the published study trustworthy; digital epidemiology tools make the local evidence actionable.