Page 8 of 24
IM2.10-13 | ACS Diagnostic Testing — SDL Guide
Learning Objectives
- Order, perform, and interpret a 12-lead ECG in the context of ACS including STEMI localisation, NSTEMI patterns, and key differentials
- Order and interpret a chest X-ray and cardiac biomarkers (troponin) in ACS
- Choose and interpret a lipid profile and identify desirable lipid targets in the clinical context
- Discuss the indications for and findings on echocardiogram, exercise stress testing, and coronary angiography in IHD
INSTRUCTIONS
Diagnostic testing in ACS is a cascade — the 12-lead ECG is the first and most time-critical test, followed by cardiac biomarkers, chest X-ray, and then second-line imaging investigations. This module builds your ability to perform and interpret each test systematically, recognise the diagnostic patterns, and select the right investigation for the right clinical question.
References
- Harrison's Principles of Internal Medicine, 21st ed., Ch. 296 — Electrocardiography (textbook)
- API Textbook of Medicine, 10th ed., Ch. on Coronary Artery Disease (textbook)
- ESC 2023 Guidelines for ACS Management (guideline)
- ACC/AHA 2022 Guideline for Chest Pain Evaluation (guideline)
Version 2.0 | NMC CBUC 2024
CLINICAL SCENARIO
A 58-year-old hypertensive man arrives in the emergency department with 90 minutes of chest pain. The nurse hands you the 12-lead ECG. In the next 60 seconds you need to answer four questions that will determine his entire management: Is this a STEMI requiring immediate reperfusion? If not STEMI, are there ischaemic ECG changes suggesting NSTE-ACS? Are there features of an alternative diagnosis — aortic dissection, pericarditis, PE? And are there dangerous arrhythmias or conduction defects requiring immediate treatment? The ECG in ACS is not merely a supporting test — it is the triage tool that activates the reperfusion pathway, guides anticoagulation choices, and determines CCU vs ward disposition. This module builds the systematic ECG interpretation framework for ACS, alongside the interpretation of cardiac biomarkers, chest X-ray, lipid profile, and the indications for advanced cardiac imaging — equipping you to deploy each test appropriately and read the results accurately.
WHY THIS MATTERS
The competencies IM2.10–2.13 are designated at SH (Skill and Higher) level for ECG, CXR, and lipid profile interpretation — meaning these are skills you must be able to perform and document, not merely recognise from a book illustration. ECG interpretation is tested in virtually every postgraduate entrance examination in India (PG-NEET, USMLE, DNB) and is a skill that attending physicians, nursing staff, and paramedics will expect a final-year student to perform competently. More importantly, in the Indian healthcare context where STEMI patients frequently present first to hospitals without cardiologists, the ability of a final-year student or junior doctor to correctly identify STEMI on a 12-lead ECG — and initiate thrombolysis — is directly life-saving.
RECALL
Recall from your cardiology and clinical skills training: the standard 12-lead ECG records electrical activity from 12 perspectives — 6 limb leads (I, II, III, aVL, aVF, and the augmented aVR) and 6 precordial leads (V1–V6). The ST segment represents ventricular repolarisation; ST elevation indicates full-thickness (transmural) ischaemia; ST depression indicates subendocardial ischaemia. The T wave follows the ST segment; T-wave inversion is a sign of ischaemia or repolarisation abnormality. From biochemistry: troponin (cardiac troponin I and T) is a structural protein of the contractile apparatus released into the blood only when myocardial cell membrane integrity is disrupted — it is highly sensitive and specific for myocardial injury. Recall the basic lipid fractions: LDL-C (atherogenic), HDL-C (cardioprotective), triglycerides, and total cholesterol — and that statins reduce LDL-C by inhibiting HMG-CoA reductase.
Clinical Indication: When and Why to Order Each ACS Test
The diagnostic evaluation of suspected ACS follows a time-stratified protocol — some tests must be available within minutes, others within hours, and advanced imaging within days. Understanding the clinical indication and the specific question each test answers is essential for efficient, cost-effective investigation that does not delay management.
The 12-lead ECG is the single most important first investigation in any patient with suspected ACS and should be obtained and interpreted within 10 minutes of first medical contact — this is the Class I recommendation in all major ACS guidelines (ESC, ACC/AHA). The ECG answers the most urgent clinical question: is this a STEMI requiring immediate reperfusion? A STEMI ECG changes triage from observation to emergency reperfusion pathway activation. No other investigation should delay ECG acquisition. Indications: any acute chest pain, unexplained dyspnoea, diaphoresis, syncope, or upper abdominal pain in a patient with IHD risk factors.
Cardiac biomarkers — high-sensitivity troponin (hs-cTnI or hs-cTnT) are the biochemical cornerstone of NSTEMI diagnosis. Troponin is obtained at first contact (time 0) and repeated at 1 hour (rapid 0/1h ESC protocol), 2 hours (0/2h protocol), or 3 hours (conventional 0/3h protocol), depending on the assay's sensitivity. The purpose: to detect any rise (>99th percentile upper reference limit, URL) indicating myocardial necrosis. A single negative troponin at presentation does not exclude ACS — serial measurement is mandatory. Creatine kinase-MB (CK-MB) is an older biomarker now superseded by high-sensitivity troponin for initial diagnosis but retains utility in detecting reinfarction (rises again with new MI after the initial peak).
Chest X-ray (CXR) provides complementary anatomical information in the ACS setting: it assesses cardiac size (cardiomegaly suggests prior LV dysfunction), pulmonary vasculature (upper lobe diversion, Kerley B lines, bat-wing haziness = pulmonary oedema), pleural effusions, mediastinal width (widened mediastinum suggests aortic dissection), and pneumothorax. It should be obtained in every ACS patient but must not delay ECG or reperfusion.
Lipid profile is ordered in all ACS patients (within 24 hours of presentation) to document baseline LDL-C and guide secondary prevention statin dosing. Note that LDL-C falls within 24–48 hours of MI onset (acute-phase response reduces apoB synthesis); therefore, LDL measured within the first day of ACS most accurately reflects the true baseline.
Echocardiogram is indicated urgently if haemodynamic compromise or mechanical complication (acute MR, VSD, cardiac tamponade) is suspected. It defines LV function (ejection fraction — LVEF), wall motion abnormalities (regional hypokinesia, akinesia, or dyskinesia indicate the infarcted territory), pericardial effusion, and valvular pathology. LVEF <40% identifies HFrEF requiring RAAS blockade and beta-blocker in secondary prevention.
Exercise stress testing (EST) and coronary CT angiography (CCTA) are used for outpatient evaluation of suspected chronic coronary syndrome (stable angina) or for risk stratification of low-risk NSTE-ACS patients after an initially negative troponin. EST is contraindicated in the acute phase of ACS and in decompensated heart failure.
Invasive coronary angiography (ICA) is the gold standard for defining coronary anatomy, quantifying stenosis severity, and guiding revascularisation decisions (PCI vs CABG vs medical therapy). Indications: primary PCI in STEMI; early invasive strategy (within 24 hours) in high-risk NSTE-ACS (GRACE score >140, ongoing ischaemia, haemodynamic instability, troponin elevation); or elective in stable CAD refractory to medical therapy.
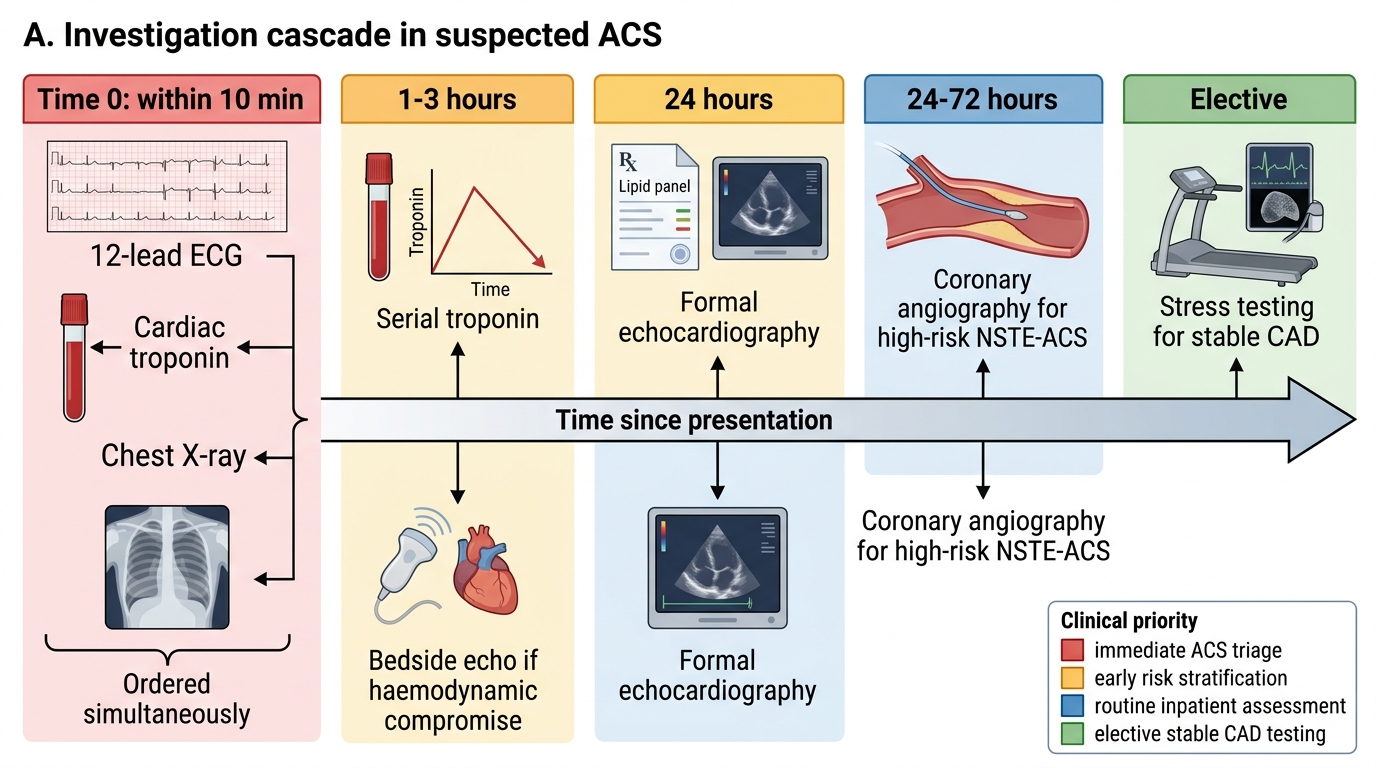
Investigation Cascade Timeline in Acute Coronary Syndrome
Governing Principles: ECG Interpretation in ACS
The 12-lead ECG interpretation in ACS requires a systematic approach that covers rate, rhythm, axis, intervals, and then the specific ischaemic changes — ST, T-wave, and Q-wave abnormalities. The systematic approach prevents missing conduction disturbances (heart block, bundle branch block) that accompany and complicate MI, and ensures that ischaemic changes are interpreted in the correct anatomical context.
Step 1 — Rate and rhythm: Identify the heart rate (normal 60–100/min), confirm sinus rhythm (P wave preceding every QRS, P-wave axis positive in I and II), and identify any arrhythmia. In the ACS context, the following arrhythmias are particularly significant: sinus tachycardia (sympathetic activation, LV failure, or haemorrhage), sinus bradycardia or complete heart block (inferior MI — RCA supplies SA and AV nodes in 90%), atrial fibrillation (new AF in MI worsens prognosis), and ventricular tachycardia/fibrillation (the primary cause of sudden death in the first 24 hours of STEMI — requires immediate defibrillation).
Step 2 — PR interval and QRS complex: PR interval >200 ms = first-degree AV block; PR shortening with delta wave = Wolff-Parkinson-White (mimics inferior STEMI in some patterns). QRS duration: >120 ms = bundle branch block. New left bundle branch block (LBBB) in a patient with ischaemic symptoms is treated as STEMI equivalent — it masks ST elevation and indicates severe LAD or left main disease. Right bundle branch block (RBBB): a new RBBB in anterior MI indicates massive septal infarction with poor prognosis.
Step 3 — QT interval: Corrected QT (QTc) prolongation (>450 ms in men, >470 ms in women) predisposes to torsades de pointes; relevant in ACS where electrolyte disturbances (hypokalaemia, hypomagnesaemia) and anti-arrhythmic drugs (amiodarone) further prolong QT.
Step 4 — ST changes (the ACS focus):
ST elevation criteria for STEMI:
- New ST elevation at the J-point in ≥2 contiguous leads:
- ≥0.1 mV (1 mm) in all leads except V2–V3
- ≥0.15 mV (1.5 mm) in V2–V3 in women
- ≥0.2 mV (2 mm) in V2–V3 in men ≥40 years
- ≥0.25 mV (2.5 mm) in V2–V3 in men <40 years
- OR new LBBB with typical ischaemic symptoms
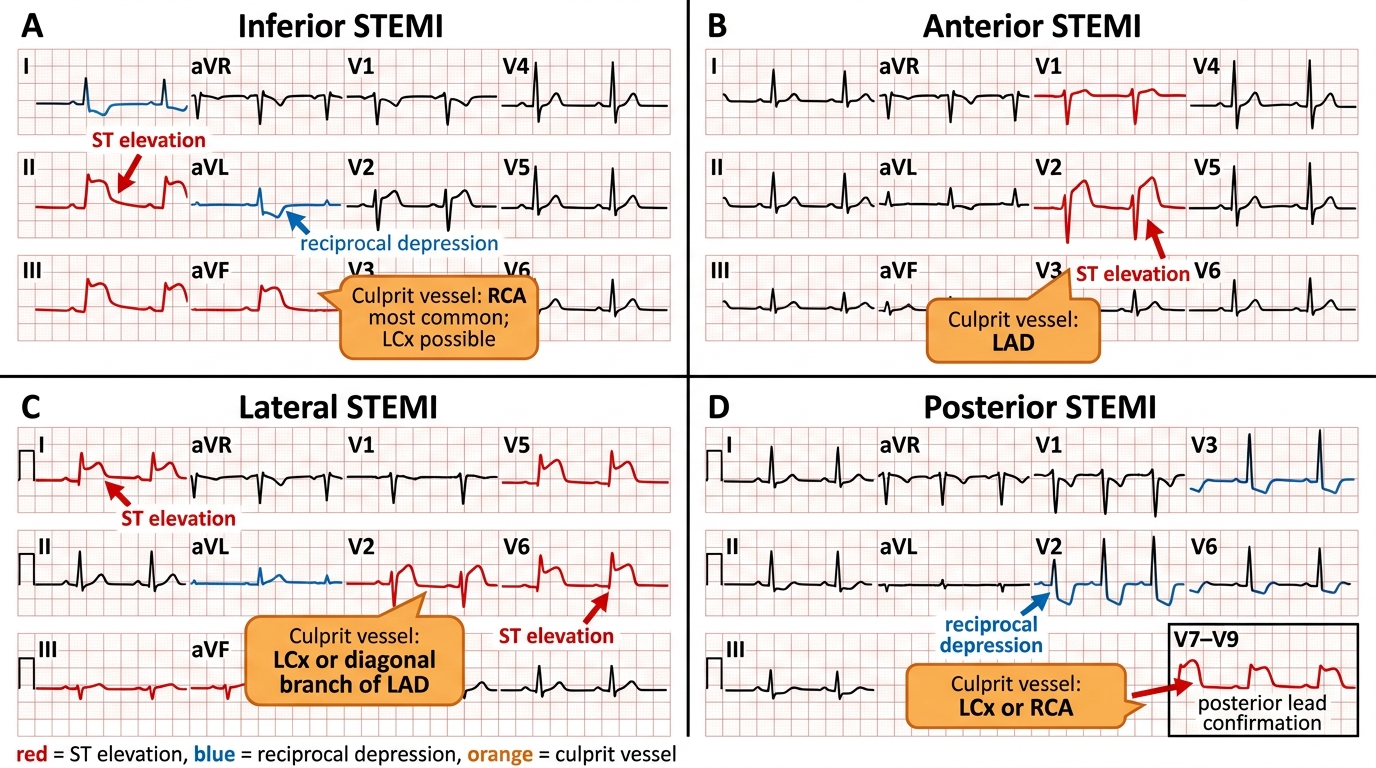
STEMI localisation by lead territory:
- Inferior STEMI: ST elevation in II, III, aVF → culprit vessel = RCA (in 85% right-dominant circulation) or LCx (left-dominant)
- Anterior STEMI: ST elevation in V1–V4 → LAD occlusion (proximal LAD → more leads involved, larger territory, worse prognosis)
- Anteroseptal: V1–V3
- Anterolateral: V1–V6, I, aVL
- Lateral STEMI: ST elevation in I, aVL, V5–V6 → LCx
- Posterior STEMI: ST depression in V1–V3 (posterior wall depolarisation seen in 'mirror image'); confirm with posterior leads V7–V9 (elevation ≥0.5 mm diagnostic); culprit = RCA or LCx
- Right ventricular STEMI: ST elevation in V4R (≥1 mm) in the context of inferior STEMI; confirms RV infarction (proximal RCA occlusion)
Reciprocal changes: ST depression in leads geometrically opposite to the elevation territory; serves as confirmatory evidence of true STEMI. Example: inferior ST elevation (II, III, aVF) → reciprocal ST depression in I, aVL.
ST depression patterns in NSTEMI/UA:
- Horizontal or downsloping ST depression ≥0.5 mm in ≥2 contiguous leads indicates subendocardial ischaemia
- New T-wave inversions ≥1 mm (particularly deep symmetric T-wave inversions in V1–V4 = Wellens syndrome patterns A and B — indicate proximal LAD stenosis about to occlude; these patients look deceptively stable but require urgent angiography)
- de Winter T-waves: tall, peaked, upsloping ST depression with tall T-waves in V1–V6 — a STEMI equivalent indicating proximal LAD occlusion despite absence of ST elevation; often missed
ECG patterns mimicking STEMI (critical differentials):
- Pericarditis: diffuse saddle-shaped ST elevation in multiple leads (not a single territory), PR depression (PR depression in limb leads is near-pathognomonic for pericarditis), no reciprocal changes
- Early repolarisation: common normal variant in young adults; ST elevation in V1–V4, concave (smiley-face) morphology, notched J-point; absence of reciprocal changes; stable over serial ECGs
- LVH with strain: ST depression and T-wave inversion in lateral leads (I, aVL, V5–V6); reciprocal ST elevation in V1–V3; distinguished from ischaemia by the context (chronic hypertension, normal troponin, stable over time)
- Hyperkalaemia: tall peaked T-waves, then widened QRS, then sine-wave pattern; not ischaemic but potentially fatal and treated differently
- Brugada pattern: right precordial (V1–V3) ST elevation with coved or saddle-back pattern; not ischaemic; associated with channelopathy and risk of sudden death
STEMI Localisation on 12-Lead ECG
Procedure and Technique: Cardiac Biomarkers and Chest X-ray Interpretation
Cardiac biomarkers and chest X-ray interpretation in ACS are procedural skills — they require a systematic approach to both ordering (correct timing, appropriate assay) and reading (pattern recognition combined with clinical context). Biomarker interpretation without clinical context and ECG correlation leads to both over-diagnosis and under-diagnosis of ACS.
Cardiac Troponin — ordering and timing protocol:
Modern high-sensitivity cardiac troponin (hs-cTn) assays detect troponin concentrations below 1 ng/L, enabling earlier and more sensitive detection of myocardial necrosis. The ESC 0h/1h rapid protocol uses hs-cTn at first blood draw and 1 hour later: a rise of >5 ng/L between draws (absolute delta) OR a value >52 ng/L at 0 h (depending on the assay) constitutes rule-in for NSTEMI. A value below the assay's rule-out threshold at both 0 h and 1 h constitutes rule-out, allowing discharge of low-risk patients. The conventional 0h/3h protocol is still widely used in India due to limited availability of hs-cTn assays.
The troponin kinetic curve in STEMI and NSTEMI follows a characteristic pattern:
- Rise begins: 3–6 hours after symptom onset (conventional assay); 1–3 hours (high-sensitivity assay)
- Peak: conventional troponin peaks at 12–24 hours; hs-cTn peaks earlier (~12 hours)
- Duration of elevation: troponin T remains elevated for 7–14 days (long half-life due to structural protein release from degrading myocytes)
- CK-MB: rises at 3–6 hours, peaks at 12–24 hours, returns to normal within 48–72 hours — useful for detecting re-infarction: a new rise after CK-MB has returned to baseline indicates a new MI event
Causes of troponin elevation other than ACS — the 'type 2 MI' and non-ischaemic causes: heart failure (acute), myocarditis (viral or autoimmune), sepsis, renal failure (reduced clearance), pulmonary embolism (RV strain), cardiac contusion, cardioversion, ablation, and extreme tachyarrhythmias. These cause troponin elevation without coronary plaque rupture — the clinical context, ECG, and imaging distinguish type 1 MI (ACS, plaque rupture) from type 2 MI (demand ischaemia) and non-ischaemic causes. The management differs fundamentally.
Chest X-ray (CXR) in ACS — systematic interpretation:
The CXR in ACS should be read systematically using an ABCDE framework adapted for cardiac presentations:
- A (Airway + Alignment): tracheal position (deviation = tension pneumothorax, large effusion, or mediastinal mass); vertebral alignment
- B (Breathing / Lung fields): pulmonary vascular pattern — upper lobe diversion (venous pressure 18–25 mmHg, Killip II); Kerley B lines (horizontal lines at costophrenic angles; interstitial oedema, venous pressure >20 mmHg); bilateral perihilar 'bat-wing' haziness (alveolar oedema, venous pressure >25 mmHg, Killip III); pleural effusions (blunted costophrenic angles); consolidation (pneumonia as alternative diagnosis)
- C (Cardiac size and Contour): cardiothoracic ratio (CTR) — ratio of maximum cardiac diameter to maximum thoracic diameter on PA film. Normal CTR <0.5. CTR >0.5 = cardiomegaly (suggests prior LV dysfunction, dilated cardiomyopathy, or pericardial effusion). Note that an AP film (taken in supine patients in the ED) magnifies the cardiac shadow — CTR on AP is not reliably interpretable as cardiomegaly without PA reference. Widened mediastinum (>8 cm on PA, >6 cm on AP) raises concern for aortic dissection.
- D (Devices): position of any existing pacemaker leads, defibrillator patches, or central line (if inserted)
- E (Everything else): rib fractures (alternative cause of chest pain, contraindication to vigorous CPR?), diaphragm position (free air suggests perforated viscus — alternative to ACS)
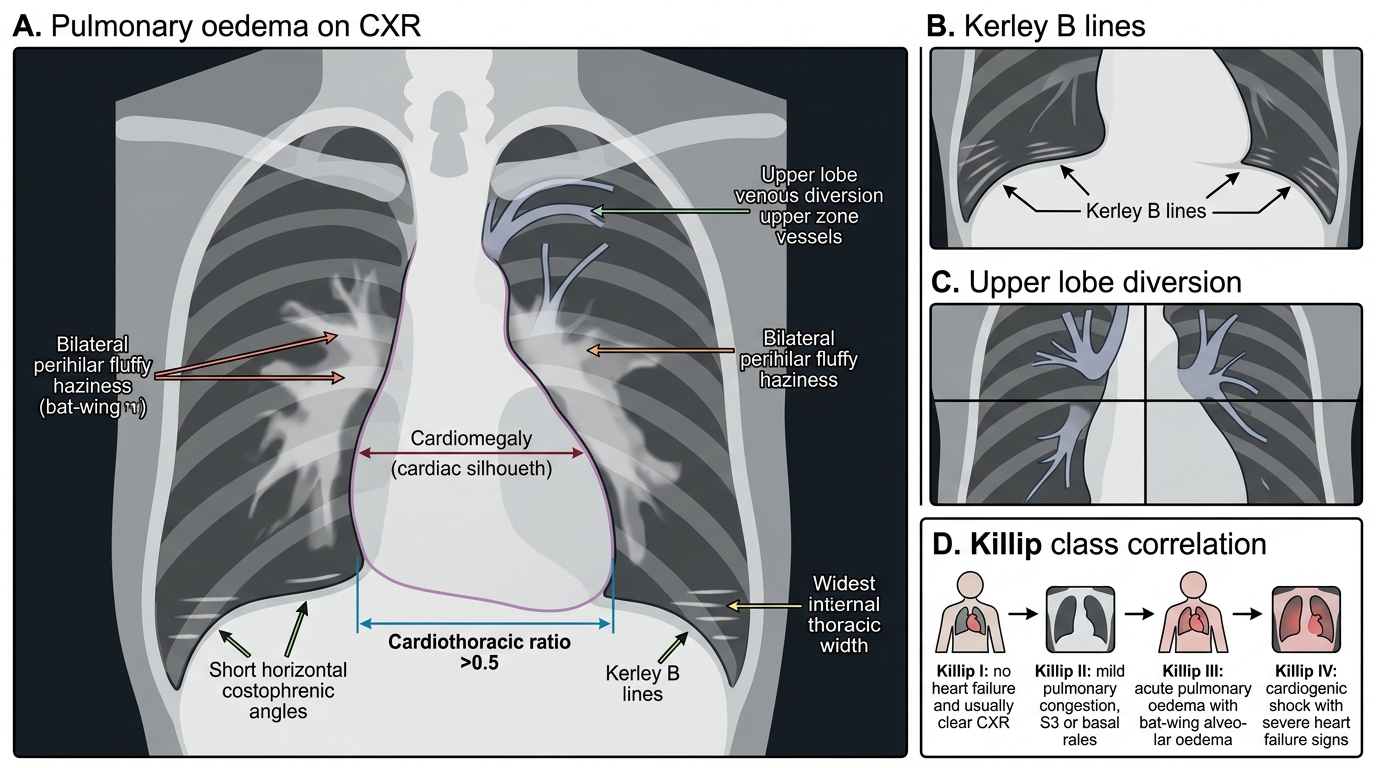
CXR Features of Pulmonary Oedema and Killip Class
SELF-CHECK
A 52-year-old man with 2 hours of chest pain has a high-sensitivity troponin T of 8 ng/L at 0 hours (99th percentile URL = 14 ng/L). Repeat hs-cTnT at 1 hour is 22 ng/L. The ECG shows no ST elevation and no ischaemic changes. What is the CORRECT interpretation?
A. Troponin is below the URL at 0h — ACS is ruled out and the patient can be discharged
B. The delta change of 14 ng/L from 0 to 1 hour meets ESC criteria for NSTEMI rule-in — treat as NSTEMI
C. The troponin elevation is non-specific and most likely due to renal failure — obtain serum creatinine before any cardiac treatment
D. A normal ECG with no ST elevation rules out any significant ACS event
Reveal Answer
Answer: B. The delta change of 14 ng/L from 0 to 1 hour meets ESC criteria for NSTEMI rule-in — treat as NSTEMI
The ESC 0h/1h rapid rule-in protocol for hs-cTnT uses an absolute delta criterion of ≥5 ng/L between 0 and 1 hour (for some assays the exact threshold varies by assay brand). Here the delta is 22 − 8 = 14 ng/L, well above the 5 ng/L threshold — this constitutes NSTEMI rule-in by the rapid protocol, even though the absolute 0h value is below the 99th percentile URL. The normal ECG does not exclude NSTEMI — NSTEMI by definition does not have ST elevation; ECG may show T-wave changes or be completely non-diagnostic. The patient requires antiplatelet therapy, anticoagulation, and risk-stratified early invasive evaluation. Renal failure should be considered as a contributing factor but does not change the requirement for urgent investigation when the delta is significant.