Page 9 of 24
IM2.10-13 | ACS Diagnostic Testing — SDL Guide (Part 2)
Interpretation: Lipid Profile, Echocardiogram, and Coronary Imaging
Beyond the ECG and troponin, the diagnostic evaluation of IHD extends to lipid profiling for risk stratification and treatment targeting, echocardiography for structural and functional assessment, and coronary imaging for definitive anatomy. Each of these modalities answers a different diagnostic question and influences a different dimension of management. Knowing when to order each test and how to interpret the result in clinical context is the practical competency these investigations demand. A lipid profile ordered at the wrong time gives a misleading LDL-C; an echocardiogram interpreted without knowledge of the ECG territory leads to erroneous conclusions about the infarct location; a stress test performed in a patient with Wellens syndrome causes preventable STEMI. The following sections build the interpretation framework for each modality, grounded in the clinical scenarios where they matter most.
Lipid Profile Interpretation:
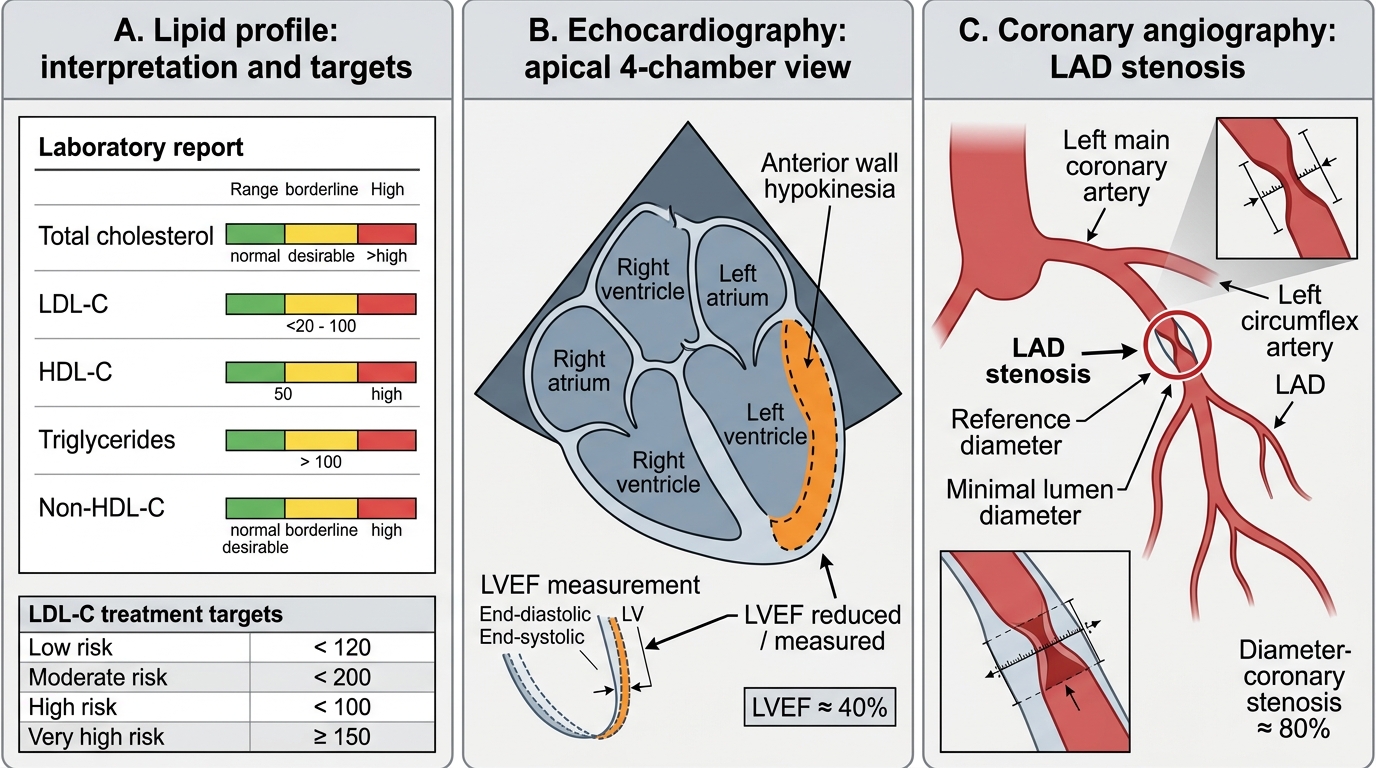
A standard lipid profile reports: total cholesterol (TC), LDL-cholesterol (LDL-C), HDL-cholesterol (HDL-C), triglycerides (TG), and calculated non-HDL cholesterol (TC − HDL). Each parameter has both a risk-classification value and a treatment-target role:
- LDL-C is the primary target of therapy. Desirable targets vary by cardiovascular risk category:
- Very high risk (prior MI, ACS, or known CAD): LDL-C <70 mg/dL (ESC/EAS 2019: even <55 mg/dL for very high risk, or ≥50% reduction from baseline)
- High risk (diabetes with target organ damage, stage 3 CKD, multiple major risk factors): LDL-C <100 mg/dL
- Moderate risk (10-year ASCVD 5–10%): LDL-C <115 mg/dL
- Low risk: LDL-C <116 mg/dL
- HDL-C: low HDL (<40 mg/dL in men, <50 mg/dL in women) is an independent cardiovascular risk factor; there is no pharmacological HDL-raising therapy with proven outcome benefit (ILLUMINATE, AIM-HIGH trials negative); focus is on lifestyle (exercise, smoking cessation, alcohol moderation)
- Triglycerides (TG): normal <150 mg/dL; borderline 150–199 mg/dL; high 200–499 mg/dL; very high ≥500 mg/dL (pancreatitis risk). Elevated TG in the context of low HDL is part of atherogenic dyslipidaemia (metabolic syndrome pattern in South Asians). Fibrates (fenofibrate) or omega-3 fatty acids reduce TG; icosapentaenoic acid (EPA, REDUCE-IT trial) reduces cardiovascular events at high TG levels in statin-treated patients
- Non-HDL-C (TC − HDL-C): captures all atherogenic lipoproteins (LDL + VLDL + IDL + Lp(a)); target = LDL-C target + 30 mg/dL; useful when TG is elevated (in which case calculated LDL-C is unreliable — Friedewald equation underestimates LDL when TG >400 mg/dL)
- Note on timing: in ACS, LDL-C obtained within 24 hours of presentation most accurately reflects the true fasting baseline (before the acute-phase response lowers ApoB synthesis). LDL measured at 48 hours to 3 months post-ACS is transiently falsely low
Echocardiography in ACS:
A bedside transthoracic echocardiogram (TTE) can be obtained in minutes and answers the following questions urgently:
- Left ventricular ejection fraction (LVEF): the cornerstone of systolic function assessment. Normal LVEF ≥55%; mildly reduced 45–54%; moderately reduced 30–44%; severely reduced <30%. In ACS: LVEF predicts short-term prognosis, guides choice of pharmacotherapy (ACE inhibitor/ARB mandatory if LVEF ≤40%), and determines need for cardiac resynchronisation therapy or ICD implantation.
- Regional wall motion abnormalities (RWMA): segmental hypokinesia (reduced motion), akinesia (absent motion), or dyskinesia (paradoxical outward motion during systole) define the infarcted or ischaemic territory. In NSTEMI with non-diagnostic ECG, RWMA on echo confirms significant ischaemia.
- Mechanical complications: papillary muscle rupture (acute MR with eccentric jet), VSD (colour Doppler shows left-to-right shunt through the septum), free wall rupture (haemopericardium and tamponade — rare but immediately fatal without surgical repair)
- Pericardial effusion: may indicate pericarditis, haemorrhagic effusion from free wall rupture, or post-cardiac injury syndrome
- RV function and size: RV dilatation and dysfunction confirm RV infarction in inferior STEMI
Exercise Stress Testing (EST) and Advanced Coronary Imaging:
Exercise ECG stress testing (treadmill or bicycle) is the first-line investigation for suspected chronic coronary syndrome (stable angina) in patients who are able to exercise and have a baseline ECG without LBBB or pre-excitation. The test is contraindicated in the acute phase of ACS, decompensated heart failure, severe aortic stenosis, and uncontrolled hypertension. A positive EST is defined as ≥1-mm horizontal or downsloping ST depression (in ≥2 contiguous leads) at a standard exercise intensity. High-risk features on EST that mandate early coronary angiography: ST depression ≥2 mm or in multiple territories, ST elevation during exercise, early positive (stage 1 Bruce protocol), sustained ventricular tachycardia, hypotension with exercise, or failure to achieve 85% predicted maximal heart rate.
Coronary CT angiography (CCTA) provides non-invasive anatomical assessment of coronary stenosis with high negative predictive value (>99%) — an excellent rule-out test for CAD in low-to-intermediate probability chest pain. It also characterises plaque morphology (calcified, mixed, non-calcified — the latter are most vulnerable). The calcium score (Agatston score) on unenhanced CT is a validated risk stratification tool for asymptomatic individuals: score 0 = very low risk; score >400 = very high risk.
Invasive coronary angiography (ICA) involves fluoroscopic visualisation of coronary anatomy after selective contrast injection via radial or femoral artery access. It is the gold standard for diagnosis and is simultaneously therapeutic — stenoses identified can be treated with PCI (balloon angioplasty and stenting) in the same session. Findings are described by coronary artery (LM, LAD, LCx, RCA), lesion location (proximal/mid/distal), and severity (percentage diameter stenosis): ≥70% = haemodynamically significant stenosis for major vessels (≥50% for LM).
⚑ AI image — pending faculty review (auto-QA score 6/10; best of 3 attempts)
Assessment Tools in Ischemic Heart Disease
SELF-CHECK
A 65-year-old man with known stable angina undergoes a standard Bruce protocol exercise treadmill test. He develops 2.5-mm horizontal ST depression in leads II, III, aVF, and V4–V6 at 4 minutes of stage 1 (low workload), accompanied by a drop in systolic blood pressure from 150 to 100 mmHg. He is stopped immediately. What is the interpretation and the correct next step?
A. Positive stress test with low-risk features — optimise medical therapy and repeat in 6 months
B. Positive stress test with high-risk features (early ST depression, multi-territory, exercise hypotension) — refer urgently for invasive coronary angiography
C. The BP drop is due to vasovagal syncope — IV atropine and repeat the test after recovery
D. 2.5-mm ST depression is non-diagnostic — only ST elevation during stress testing indicates significant CAD
Reveal Answer
Answer: B. Positive stress test with high-risk features (early ST depression, multi-territory, exercise hypotension) — refer urgently for invasive coronary angiography
This is a high-risk positive exercise stress test. High-risk features present here: (1) ST depression ≥2 mm (here 2.5 mm — threshold for high risk), (2) multi-territory ST depression (inferior + lateral leads), (3) early onset (stage 1, low workload — signifying poor coronary flow reserve at minimal effort), and (4) exercise-induced hypotension (systolic BP fall ≥10 mmHg from baseline — indicates global LV ischaemia and failure to augment cardiac output with exercise, consistent with left main or three-vessel disease). These features mandate urgent referral for invasive coronary angiography because they predict a high probability of left main or three-vessel disease that may confer a survival benefit from CABG. Optimising medical therapy alone is insufficient given the high-risk features.
Applied Practice: Integrating Diagnostics in the ACS Workup
The diagnostic tests for ACS do not operate in isolation — each test is integrated with the clinical history, examination, and preceding investigations to generate a coherent picture that drives management. The most common clinical errors in ACS diagnostics arise not from inability to read a single test but from failure to integrate multiple results correctly: a negative troponin at presentation taken to mean 'no ACS' without serial testing; ST depression in V1–V3 interpreted as anterior ischaemia rather than posterior STEMI; or troponin elevation attributed to renal failure without adequate clinical exclusion of type 1 MI. This section builds the integration skills through worked diagnostic scenarios.
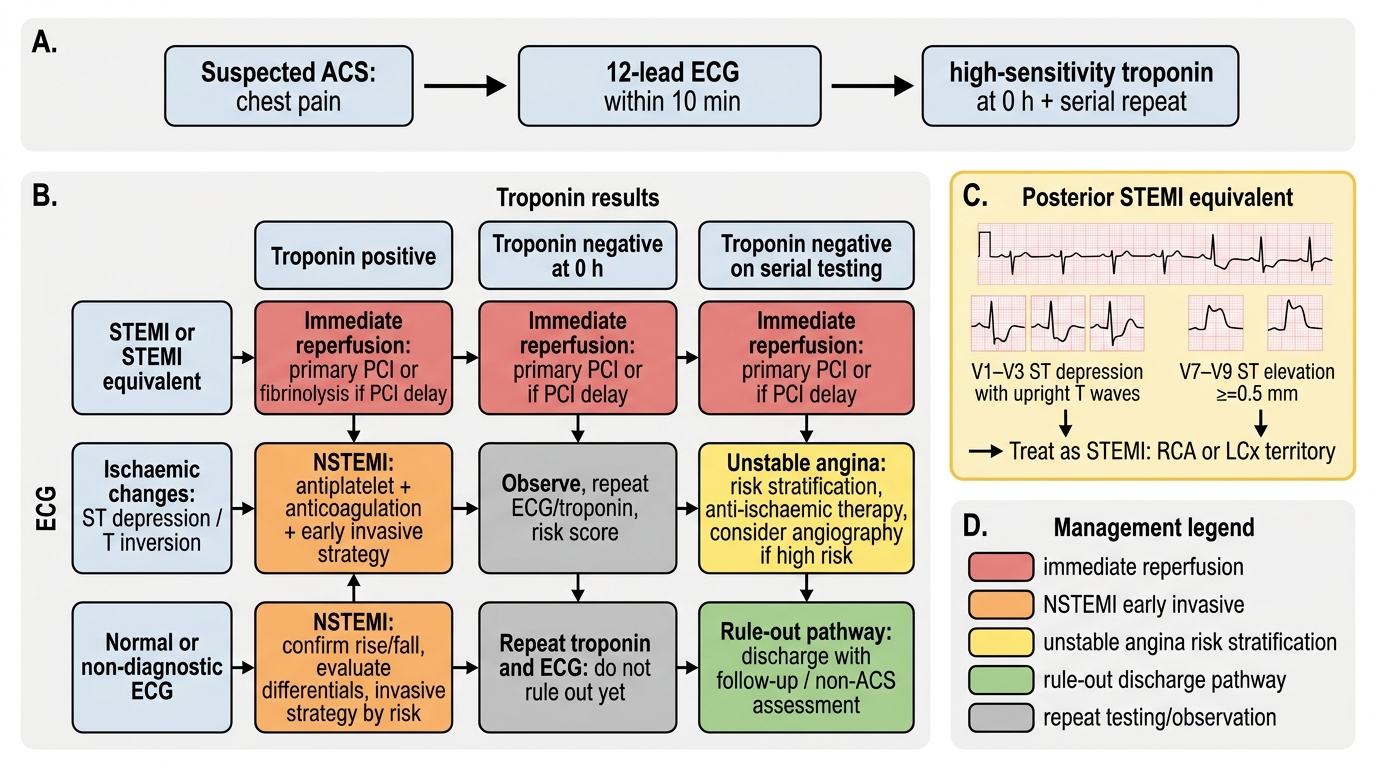
Integration principle 1 — The ECG and troponin must be interpreted together, not in isolation. A positive troponin with a normal ECG is NSTEMI (common — up to 50% of NSTEMI have no ECG changes). A positive ECG (ST elevation) with a negative initial troponin is still STEMI (troponin hasn't risen yet — treat with immediate reperfusion; don't wait for troponin). A positive troponin with normal ECG and no coronary anatomy on angiography suggests myocarditis — requires cardiac MRI.
Integration principle 2 — The CXR Killip class must match the clinical examination Killip class. Discordance — e.g., CXR showing bat-wing pulmonary oedema but a patient who appears clinically well — should prompt reassessment. In severe mitral regurgitation (papillary muscle rupture), massive pulmonary oedema can appear very rapidly and may outpace clinical signs.
Integration principle 3 — Lipid profile in ACS must be interpreted in context of timing. LDL-C drawn immediately on admission reflects true baseline; LDL drawn at 48 hours may be falsely low (acute-phase reaction). For the secondary prevention statin decision, the admission LDL guides choice of statin intensity — high-intensity statin (rosuvastatin 20–40 mg or atorvastatin 40–80 mg) is initiated in all ACS patients regardless of baseline LDL.
Integration principle 4 — Echo and ECG territory must be concordant. Anterior STEMI (LAD, V1–V4) should produce anterior wall motion abnormality on echo; inferior STEMI (RCA, II/III/aVF) should produce inferior and posterior wall abnormality. Discordance — e.g., echo showing anterior wall akinesia with an ECG showing only inferior changes — suggests either a wrap-around LAD or prior anterior MI with current inferior event.
ACS Diagnosis by ECG and Troponin Integration
SELF-CHECK
A 45-year-old woman presents with 4 hours of chest pain. ECG shows ST depression in V1–V3 only, with upright T-waves in those leads. Her posterior leads (V7–V9) show 0.6-mm ST elevation. High-sensitivity troponin is markedly elevated. What is the correct ACS diagnosis and the culprit territory?
A. Anterior NSTEMI — LAD territory ischaemia with V1–V3 ST depression
B. Posterior STEMI — ST depression in V1–V3 is the mirror image of posterior wall ST elevation; confirmed by posterior leads; culprit is RCA or LCx
C. Pericarditis — diffuse ST changes in multiple leads
D. NSTEMI — the posterior leads are unreliable and should not change the diagnosis
Reveal Answer
Answer: B. Posterior STEMI — ST depression in V1–V3 is the mirror image of posterior wall ST elevation; confirmed by posterior leads; culprit is RCA or LCx
ST depression in V1–V3 with upright T-waves is the classic 'mirror image' of posterior wall ST elevation. The posterior wall faces the back, so standard ECG leads V1–V3 (facing the anterior chest) show a reciprocal (inverted) image: ST depression instead of elevation, tall R instead of Q waves. Posterior leads V7–V9 (placed at the back) record the posterior wall directly, and ≥0.5-mm elevation in any two consecutive posterior leads confirms posterior STEMI. The culprit vessel is the RCA (posterior descending artery territory, in right-dominant circulation) or LCx (in left-dominant or co-dominant circulation). This is a STEMI requiring immediate reperfusion. Labelling it as NSTEMI or NSTE-ACS and not activating the reperfusion pathway is a critical error.
Self-Assessment: ACS Diagnostic Integration
This self-assessment integrates ECG interpretation, biomarker analysis, CXR findings, lipid profiling, and advanced imaging indications into complete diagnostic scenarios. Work through each scenario systematically before reading the analysis. The skill being tested is diagnostic integration — correlating multiple test results with the clinical picture to arrive at the correct ACS category and immediate management decision. This is the diagnostic reasoning that the NMC IM2.10–2.13 competencies at the SH level require you to demonstrate in a real clinical encounter.
Scenario A: A 61-year-old man with hypertension and diabetes presents 2 hours after onset of chest pain. ECG shows 3-mm ST elevation in II, III, aVF with 2-mm ST depression in I, aVL. Troponin is pending. CXR shows cardiomegaly but clear lung fields. BP 90/60 mmHg. JVP is elevated. What is the ACS category, Killip class, and the immediate management priorities?
Analysis: ECG: inferior STEMI (ST elevation II/III/aVF with reciprocal depression I/aVL → RCA occlusion). CXR: cardiomegaly (likely prior hypertensive or prior ischaemic LV disease); importantly, clear lung fields despite hypotension. JVP elevated + hypotension + clear lungs = right ventricular infarction (RCA occlusion proximal to RV marginal branches). Killip class IV (cardiogenic shock — hypotension with evidence of poor perfusion; in RV-infarction variant, clear lungs rather than pulmonary oedema). Immediate management: right-sided ECG (confirm V4R ST elevation), IV fluid bolus (NOT diuretics), reperfusion activation (primary PCI/thrombolysis). Troponin will be elevated — do not wait for it.
Scenario B: A 38-year-old woman presents to a clinic with 3 weeks of exertional chest tightness. Resting ECG shows T-wave inversions in V1–V3. Resting troponin is negative. What investigation would best evaluate her coronary anatomy, and what findings would prompt coronary angiography?
Analysis: Resting ECG with T-wave inversions in V1–V3 in a young woman is not diagnostic of ACS (could be normal variant or non-specific). No acute event, no troponin elevation. This is suspected chronic coronary syndrome. Initial investigation: exercise stress test (assess functional significance of any stenosis; if LBBB or pre-excitation present, use nuclear stress or stress echo instead). If high-risk features on EST (early ST depression, multi-territory, exercise hypotension) → coronary angiography. If the T-wave inversions are deep and symmetric in V1–V4, consider Wellens syndrome — a post-ischaemic pattern indicating critical LAD stenosis after a spontaneous reperfusion episode; in this pattern, stress testing is actually dangerous (may precipitate STEMI) — refer directly for angiography.
Scenario C: A 70-year-old man with prior MI (stented 4 years ago) presents for a routine follow-up. His lipid profile shows: total cholesterol 5.1 mmol/L, LDL-C 2.8 mmol/L (108 mg/dL), HDL-C 1.0 mmol/L (38 mg/dL), TG 2.6 mmol/L (230 mg/dL). He is on atorvastatin 20 mg. What is the adequacy of his current statin therapy and how would you adjust his management?
Analysis: As a patient with prior MI (documented ACS/revascularisation), he is in the very high-risk category. ESC/EAS 2019 LDL-C target for very high risk: <55 mg/dL (1.4 mmol/L) with ≥50% LDL reduction from untreated baseline. His current LDL of 108 mg/dL (2.8 mmol/L) is well above target. Action: (1) Intensify statin — switch to high-intensity statin (rosuvastatin 20–40 mg or atorvastatin 40–80 mg). (2) If target not reached on maximum-tolerated statin, add ezetimibe (further ~20% LDL reduction). (3) If still above target, consider PCSK9 inhibitor (evolocumab or alirocumab). (4) His low HDL (38 mg/dL) and elevated TG (230 mg/dL) = atherogenic dyslipidaemia — add lifestyle modification (weight reduction, exercise, reduce refined carbohydrates) and consider EPA (icosapentaenoic acid) if TG remains >135 mg/dL on statin therapy (REDUCE-IT benefit demonstrated).
CLINICAL PEARL
The de Winter T-wave pattern is a STEMI equivalent that is frequently missed because the ECG lacks obvious ST elevation. De Winter pattern: tall, prominent, symmetric T-waves with an upsloping ST segment depression (1–3 mm) at the J-point in V1–V6, often with ST elevation in aVR. This pattern indicates acute proximal LAD occlusion and requires immediate reperfusion — it does NOT evolve into classic STEMI in most cases. Every student learning ACS ECG interpretation should recognise this pattern, as missing it means denying a patient emergency PCI for a proximal LAD occlusion.
Second pearl: Wellens syndrome — deep symmetric T-wave inversions or biphasic T-waves in V2–V3 (Wellens type A or B) — is a post-ischaemic reperfusion pattern indicating a critical proximal LAD stenosis that has spontaneously reperfused. The patient may be pain-free at presentation. Performing an exercise stress test in this patient is dangerous — it may re-precipitate ischaemia in a vulnerable LAD territory. Wellens syndrome = direct coronary angiography, not stress test.