Page 1 of 19
IM9.1-2 | Anaemia Foundations — SDL Guide
Learning Objectives
- Define anaemia using WHO haemoglobin thresholds by age and sex
- Classify anaemia morphologically using MCV into microcytic, normocytic, and macrocytic categories, and kinetically by reticulocyte index
- Describe the morphological characteristics, aetiology, and India-relevant prevalence of iron deficiency anaemia, megaloblastic anaemia (B12 and folate), haemolytic anaemias (SCD, thalassaemia, G6PD, AIHA), anaemia of chronic disease, and aplastic anaemia
- Distinguish iron deficiency anaemia from thalassaemia trait and from anaemia of chronic disease using iron studies and RDW
- Identify the key peripheral blood film morphology associated with each anaemia type
INSTRUCTIONS
Anaemia is one of the most common conditions encountered in general medicine worldwide, and India bears a disproportionate burden. This foundational module builds the two-axis classification framework — morphological (MCV) and kinetic (reticulocyte index) — and maps it to the major aetiologies, with particular attention to the India-specific epidemiology of iron deficiency, haemoglobinopathies, and B12 deficiency. Master this classification matrix and the peripheral blood film morphology before proceeding to the clinical evaluation and diagnostic modules.
References
- Harrison's Principles of Internal Medicine, 21st ed., Ch. 91–99 — Anaemia (textbook)
- API Textbook of Medicine, 10th ed., Section on Haematology (textbook)
- Davidson's Principles and Practice of Medicine, 23rd ed., Ch. 25 — Haematology (textbook)
- WHO. Haemoglobin concentrations for the diagnosis of anaemia and assessment of severity. 2011 (guideline)
- NFHS-5 (2019–21). National Family Health Survey, India — Anaemia prevalence data (guideline)
Version 2.0 | NMC CBUC 2024
CLINICAL SCENARIO
Rekha is a 28-year-old schoolteacher from rural Maharashtra. She comes to the medicine OPD complaining of fatigue for three months, breathlessness on climbing one flight of stairs, and a persistent craving to eat clay — a symptom her mother also remembers experiencing during pregnancy. Her conjunctivae are pale, her tongue smooth and slightly sore, and her fingernails are flattened. Her haemoglobin is 7.2 g/dL. The resident orders a blood film and sees small, pale red cells with a large central pallor. Now consider a second patient in the same waiting room: Suresh, a 45-year-old man with a six-month history of vague epigastric discomfort, one episode of melaena, and increasing tiredness. His haemoglobin is 8.6 g/dL, but his MCV is 68 fL and his serum ferritin is 4 µg/L. Across town, a 65-year-old retired government officer, Vijay, has come for a routine check-up — his haemoglobin is 9.4 g/dL, his MCV is 102 fL, and his neurologist has noted a new sensory ataxia. These three patients share a single symptom — anaemia — but their underlying pathologies, morphological appearances, and management pathways diverge completely. Understanding how to classify, characterise, and aetiology-map anaemia is the foundation of all subsequent diagnostic and therapeutic decisions.
WHY THIS MATTERS
India bears the highest burden of anaemia in the world. The National Family Health Survey-5 (2019–21) reported anaemia in approximately 57% of women aged 15–49 years, 67% of children under 5, and 25% of men aged 15–49. Iron-deficiency anaemia is the most prevalent form, but haemolytic anaemias — particularly thalassaemia and sickle cell disease — are of major epidemiological importance in tribal populations across Maharashtra, Chhattisgarh, Odisha, and Gujarat. Vitamin B12 deficiency is under-recognised and frequently misdiagnosed as neurological disease. For the NMC competencies IM9.1 and IM9.2, you are expected to classify anaemia by RBC size and reticulocyte count, and to describe the morphological characteristics, aetiology, and prevalence of each cause at the KH (applied knowledge) level. This foundation underpins every downstream clinical and management decision covered in this cluster.
RECALL
Before proceeding, activate prior knowledge from physiology and biochemistry. Haemoglobin (Hb) is a tetrameric protein comprising two pairs of globin chains (normally α₂β₂ in adult HbA) and four haem groups, each containing a ferrous (Fe²⁺) iron atom at the centre of a porphyrin ring that reversibly binds oxygen. Red blood cells (RBCs) are produced in the bone marrow under the influence of erythropoietin (EPO), a hormone secreted by peritubular interstitial cells of the kidney in response to hypoxia. The normal RBC lifespan is approximately 120 days, after which senescent cells are phagocytosed by macrophages in the spleen and liver (extravascular haemolysis). Recall the haemogram parameters: haemoglobin, haematocrit (PCV), RBC count, mean corpuscular volume (MCV), mean corpuscular haemoglobin (MCH), mean corpuscular haemoglobin concentration (MCHC), and RBC distribution width (RDW). Understanding each parameter's derivation is essential to interpreting morphological classification.
Definition and Pathophysiological Basis of Anaemia
Anaemia is defined by the World Health Organization as a haemoglobin concentration below the threshold appropriate for age and sex: less than 13.0 g/dL in adult males, less than 12.0 g/dL in non-pregnant women of reproductive age, and less than 11.0 g/dL in pregnant women. These thresholds acknowledge the physiological haemodilution of pregnancy (plasma volume expansion exceeds red cell mass expansion) and the testosterone-driven erythropoietic stimulus in adult males. In children, age-specific normative values apply: below 11.0 g/dL from 6 months to 5 years, below 11.5 g/dL from 5–11 years, and below 12.0 g/dL from 12–14 years (WHO 2011). Altitude adjustment is also necessary — at altitudes above 1000 m, higher haemoglobin is physiological and the WHO thresholds systematically under-diagnose anaemia without correction.
Functionally, anaemia is a state of reduced oxygen-carrying capacity of the blood. The physiological consequences follow directly from tissue hypoxia and the compensatory responses it triggers. The cardiovascular system compensates through increased cardiac output — initially by increased stroke volume (using the Frank-Starling mechanism), and subsequently by a rise in heart rate — which together produce the hyperdynamic circulation characteristic of moderate-to-severe anaemia: tachycardia, bounding pulses, wide pulse pressure, an apical systolic flow murmur, and cardiomegaly in chronic states. The respiratory system compensates by increasing minute ventilation, and the haemoglobin-oxygen dissociation curve shifts rightward (due to increased 2,3-bisphosphoglycerate — 2,3-BPG — in response to hypoxia), which reduces haemoglobin's affinity for oxygen and facilitates peripheral unloading. These compensatory mechanisms explain the clinical symptoms: fatigue, dyspnoea on exertion, palpitations, headache, and poor concentration — all reflecting oxygen deficit at the tissue level.
Severity classification by WHO is clinically useful for guiding management intensity:
- Mild: Hb 10.0–11.9 g/dL (women) / 10.0–12.9 g/dL (men)
- Moderate: Hb 7.0–9.9 g/dL
- Severe: Hb 4.0–6.9 g/dL
- Life-threatening (very severe): Hb <4.0 g/dL
The rate of onset is as important as the absolute level. Acute blood loss causing haemoglobin to fall to 8 g/dL over 24 hours is far more symptomatic than chronic iron deficiency causing the same level over 6 months, because the compensatory mechanisms have had no time to adapt in the former scenario.
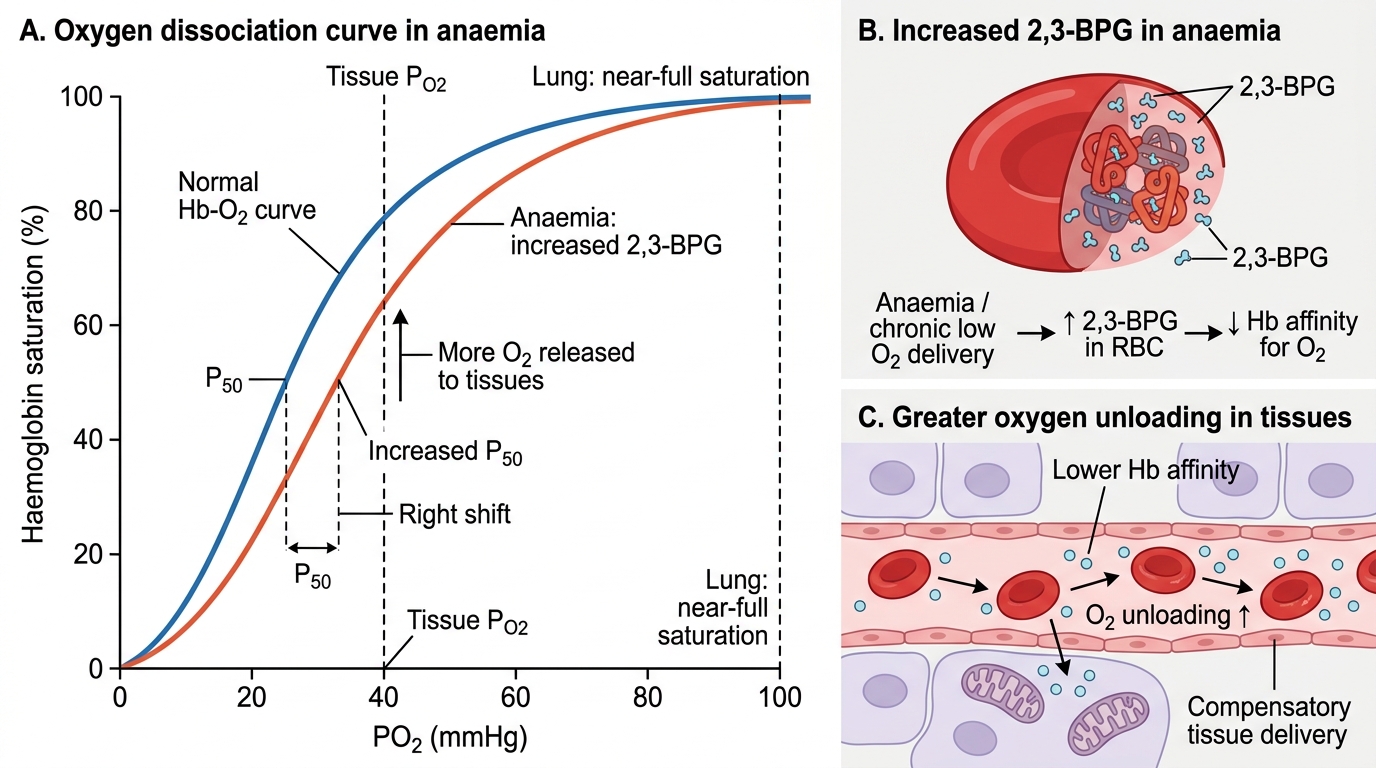
Right Shift of Oxygen Dissociation Curve in Anaemia
Morphological Classification by MCV and RBC Indices
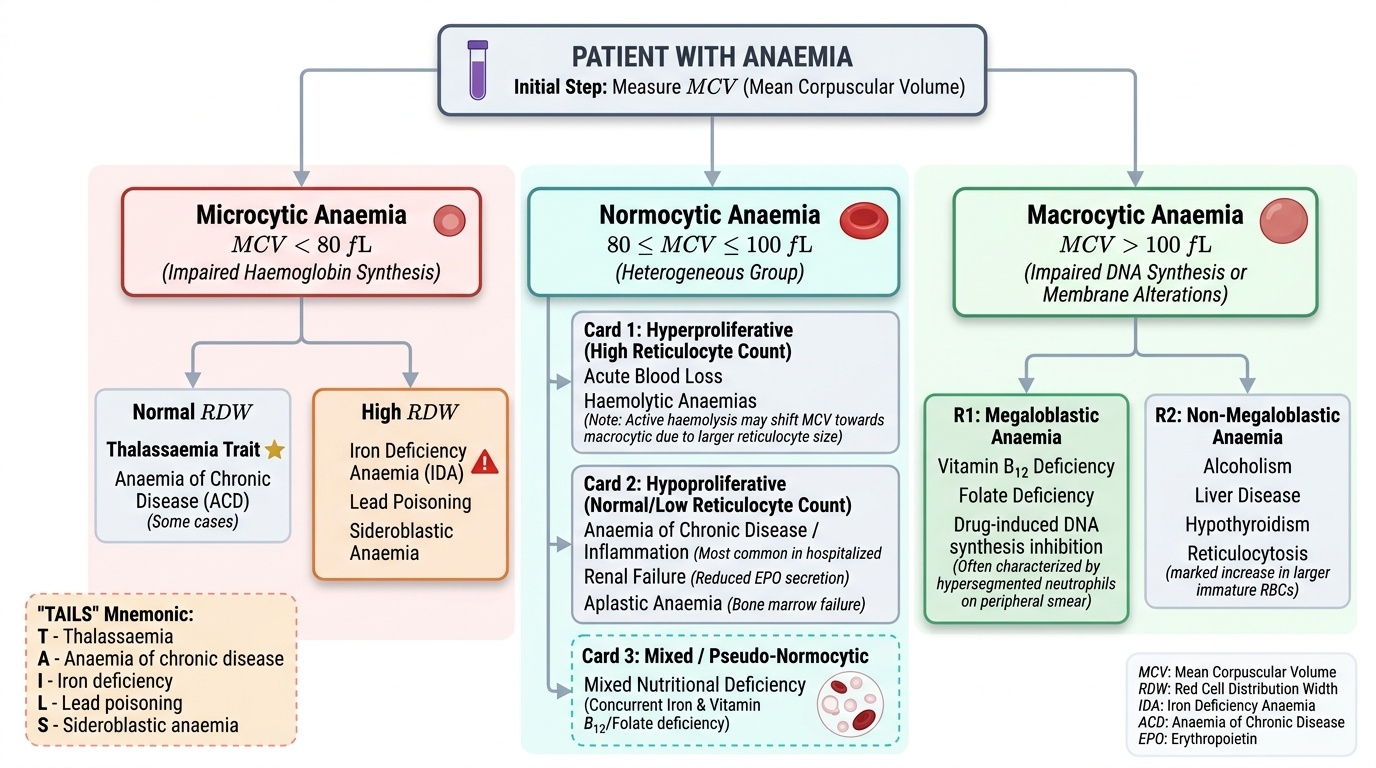
The most practical and universally used primary classification of anaemia is morphological, based on the mean corpuscular volume (MCV) of the red blood cells — derived by dividing the haematocrit by the RBC count (MCV = PCV / RBC × 10, in femtolitres). Normal MCV is 80–100 fL. This gives three primary categories: microcytic (MCV <80 fL), normocytic (MCV 80–100 fL), and macrocytic (MCV >100 fL). Each category has a defined pathophysiological basis and narrows the differential diagnosis substantially before any disease-specific tests are ordered.
Provided image
Microcytic anaemia (MCV <80 fL) reflects impaired haemoglobin synthesis. Because haemoglobin synthesis depends on three components — iron, porphyrin, and globin chains — deficiency or dysfunction in any of these components prevents normal haemoglobin loading into developing red cells, which therefore undergo additional mitotic divisions to compensate, producing abnormally small (microcytic) and abnormally pale (hypochromic — low MCH and MCHC) erythrocytes. The mnemonic TAILS covers the causes: Thalassaemia, Anaemia of chronic disease (some cases — typically normocytic but can be mildly microcytic), Iron deficiency anaemia (the most common worldwide cause), Lead poisoning (sideroblastic pattern), and Sideroblastic anaemia. In the Indian context, IDA and thalassaemia trait account for the vast majority of microcytic cases.
Normocytic anaemia (MCV 80–100 fL) is the most heterogeneous category. It encompasses: acute blood loss (before compensatory reticulocytosis shifts the picture), anaemia of chronic disease / anaemia of inflammation (the commonest cause of normocytic anaemia in hospitalised patients), haemolytic anaemias (both intrinsic and extrinsic — the compensatory reticulocytosis may slightly elevate MCV; when active haemolysis causes a strong reticulocytosis, MCV may even become mildly macrocytic since reticulocytes are larger than mature RBCs), aplastic anaemia (bone marrow failure), renal failure (reduced erythropoietin secretion), hypothyroidism (mild normocytic or macrocytic), and mixed nutritional deficiency (concurrent iron and B12 deficiency produces a dimorphic film with two populations of cells, yielding a normal average MCV — the classic 'pseudo-normocytic' picture).
Macrocytic anaemia (MCV >100 fL) results from impaired DNA synthesis, causing cells to grow but fail to divide normally, producing large oval (megaloblastic) cells. The two broad subcategories are megaloblastic and non-megaloblastic. Megaloblastic macrocytosis is caused by deficiency of vitamin B12 (cobalamin) or folate, both of which are essential cofactors for thymidylate synthesis (the rate-limiting step in DNA synthesis); it characteristically also affects rapidly dividing cells of the bone marrow, producing hypersegmented neutrophils (≥5-lobed in >5% of neutrophils, or any neutrophil with ≥6 lobes — the most sensitive peripheral film marker of megaloblastic change), and hypercellular marrow with megaloblastic change. Non-megaloblastic macrocytosis occurs without impaired DNA synthesis: causes include liver disease (macrocytosis from lipid abnormalities of the RBC membrane), hypothyroidism (slow RBC turnover + lipid changes), chronic alcohol use (direct toxic effect on marrow, liver disease, and folate malabsorption), drugs (hydroxyurea, methotrexate, zidovudine — interfere with DNA synthesis), and reticulocytosis from any cause.
RDW (red cell distribution width) complements MCV classification. An elevated RDW (>14.5%) indicates anisocytosis — variation in red cell size. In iron deficiency, RDW rises early and before MCV falls (a sensitive early marker of iron deficiency). In thalassaemia trait, RDW is typically normal or mildly elevated (uniform small cells), whereas iron deficiency shows a markedly elevated RDW. This MCV-RDW grid (Bessman classification) helps distinguish IDA from thalassaemia trait and from mixed deficiency states.
Reticulocyte Count and Kinetic Classification
The reticulocyte is a young red blood cell that has recently been released from the bone marrow; it retains residual ribosomal RNA for 1–2 days in the peripheral blood, visualised as a reticulated (net-like) pattern on supravital staining with brilliant cresyl blue or new methylene blue. The reticulocyte count provides the second axis of anaemia classification — not morphology but kinetics: is the bone marrow responding appropriately to the anaemia?
Provided image
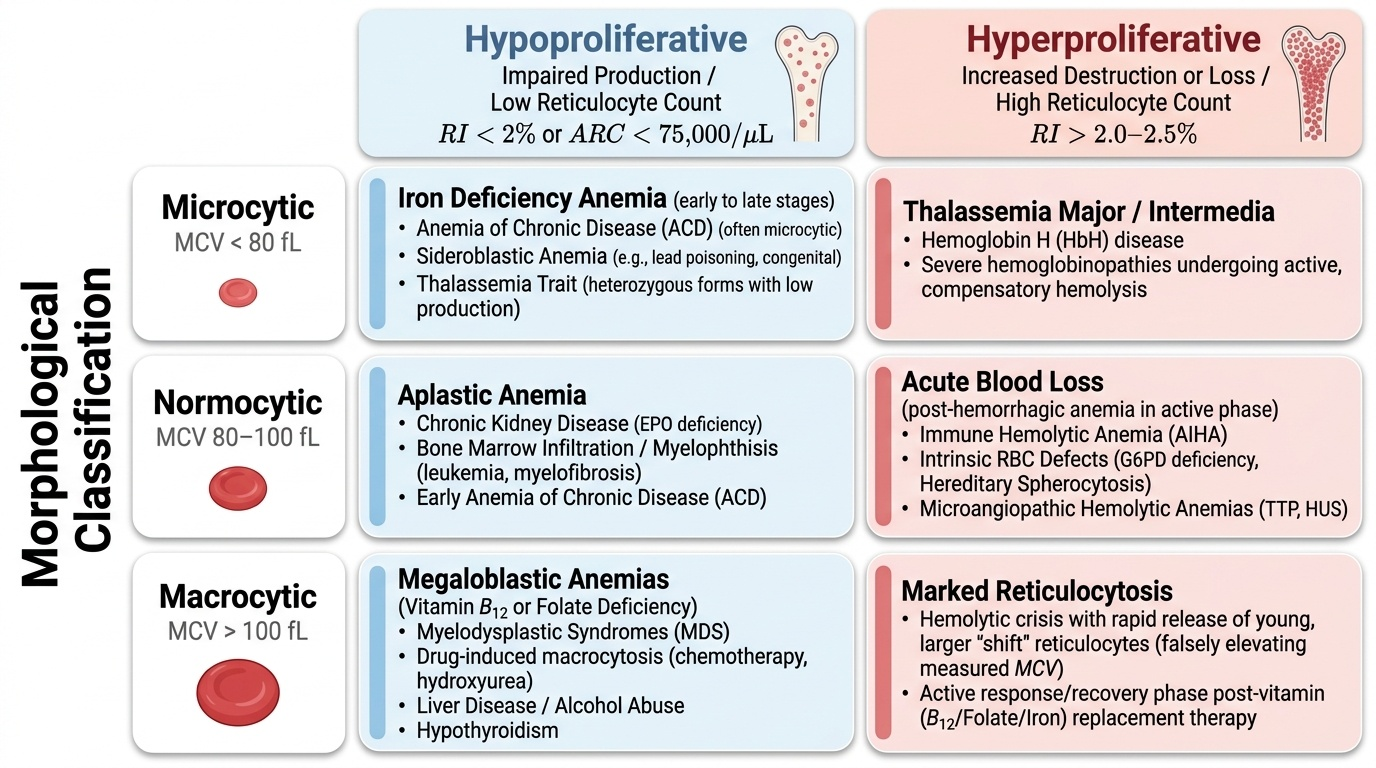
The reticulocyte percentage in normal adults is 0.5–1.5% of RBCs. However, because the percentage depends on the denominator (total RBC count), it must be corrected when the haematocrit is low to avoid a false impression of high reticulocyte production. The corrected reticulocyte count (reticulocyte index, RI) adjusts for anaemia: RI = reticulocyte% × (patient haematocrit / 45). A further correction for 'shift reticulocytes' (early-released reticulocytes that circulate for >1 day) divides the RI by the maturation factor (1.5 at Hct 35%, 2.0 at Hct 25%, 2.5 at Hct 15%). Modern automated analysers provide the absolute reticulocyte count (ARC) and the immature reticulocyte fraction (IRF), which are more accurate than the manual corrected count.
Hyperproliferative (elevated RI >2.0–2.5): the bone marrow is producing red cells at an accelerated rate, indicating either blood loss (acute haemorrhage) or haemolysis (RBC destruction). The marrow is intact and responding. This pattern defines haemolytic anaemia and post-haemorrhagic anaemia in their active phase.
Hypoproliferative (low RI <2.0): the marrow is failing to increase production in proportion to the degree of anaemia — either because a substrate is deficient (iron, B12, folate), because erythropoietin production is reduced (renal failure, hypothyroidism), because the marrow itself is suppressed or replaced (aplastic anaemia, leukaemia, myelofibrosis), or because of the functional iron blockade of chronic inflammation (anaemia of chronic disease). This kinetic distinction — combined with the MCV-based morphological category — produces the two-axis classification matrix that drives the investigation algorithm.
SELF-CHECK
A 35-year-old woman has Hb 8.2 g/dL, MCV 72 fL, and RDW 18.5%. She is asymptomatic except for fatigue. Her RBC count is normal. Which of the following BEST characterises her morphological picture?
A. Macrocytic hypochromic — suspect B12 deficiency
B. Normocytic normochromic — suspect anaemia of chronic disease
C. Microcytic hypochromic with high anisocytosis — suspect iron deficiency anaemia
D. Microcytic normochromic with low anisocytosis — suspect thalassaemia trait
Reveal Answer
Answer: C. Microcytic hypochromic with high anisocytosis — suspect iron deficiency anaemia
MCV 72 fL is microcytic. High RDW (18.5%) indicates marked anisocytosis — red cells vary in size. Iron deficiency anaemia produces microcytic hypochromic red cells with high RDW (early rise in RDW is actually the most sensitive marker of iron deficiency, preceding the MCV fall). Thalassaemia trait also produces microcytic cells but typically shows a NORMAL or mildly elevated RDW (cells are uniformly small). This MCV-RDW combination (low MCV + high RDW) therefore points to IDA over thalassaemia trait.