Page 3 of 14
OG1.1-3 | Maternal, Perinatal, Stillbirth and Abortion Statistics — SDL Guide (Part 3)
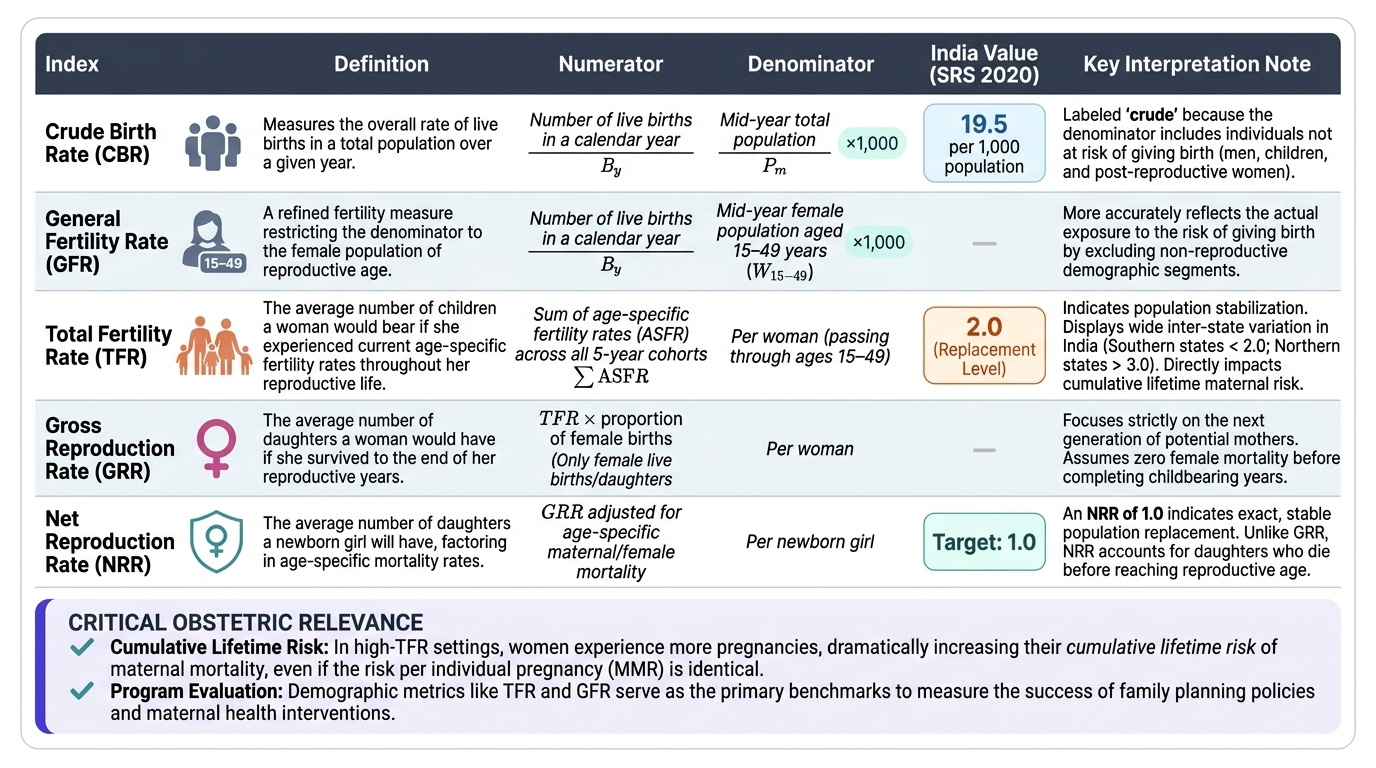
Birth Rate and Fertility Indices
Birth-rate indices provide the context in which maternal and perinatal mortality indicators must be interpreted, and they form part of the broader vital statistics framework tested in NMC assessments.
The Crude Birth Rate (CBR) = (Number of live births in a calendar year) ÷ (Mid-year total population) × 1,000. It is 'crude' because it uses the entire population — including men, children, and post-reproductive women — as the denominator. India's CBR was approximately 19.5 per 1,000 population (SRS 2020), reflecting the country's demographic transition. The SDG-era national health policy targets a CBR consistent with replacement-level fertility.
The General Fertility Rate (GFR) is a more refined measure: GFR = (Live births) ÷ (Mid-year female population aged 15–49 years) × 1,000. By restricting the denominator to women in the reproductive age group, the GFR better reflects actual exposure to the risk of giving birth.
The Total Fertility Rate (TFR) = Sum of age-specific fertility rates across all 5-year age groups from 15–19 through 45–49. It represents the average number of children a woman would have if she were to pass through her entire reproductive life at the current age-specific rates. India's TFR reached the replacement level of approximately 2.0 in 2020 (SRS), though with wide inter-state variation — southern states have TFRs well below 2.0 while some northern states exceed 3.0.
The Gross Reproduction Rate (GRR) counts only female live births (daughters) per woman — essentially TFR × proportion of female births. The Net Reproduction Rate (NRR) adjusts GRR for age-specific mortality, giving the average number of daughters a girl born today will herself have. An NRR of 1.0 indicates exact population replacement.
These indices are relevant to obstetrics because: (a) higher TFR settings have more births per woman and therefore higher cumulative lifetime risk of maternal death even if the per-pregnancy MMR is the same; and (b) programme evaluations of interventions like family planning measure success through changes in TFR and GFR.
Provided image
Mechanisms and Determinants of Maternal and Perinatal Mortality
Understanding the mechanisms and determinants of maternal and perinatal mortality is essential for interpreting vital statistics and designing interventions. The classic 'three delays' model (Thaddeus and Maine, 1994) organises determinants of maternal death around the points at which delays in care occur: Delay I — delay in deciding to seek care (due to failure to recognise danger signs, financial barriers, cultural norms, low decision-making power of women); Delay II — delay in reaching an appropriate facility (due to geographic isolation, poor roads, inadequate transport); Delay III — delay in receiving adequate care at the facility (due to staff shortages, lack of blood and drugs, skill gaps). Most Indian maternal deaths involve multiple delays simultaneously.
Direct causes of maternal death in India, by approximate contribution:
1. Haemorrhage (postpartum haemorrhage is the leading single cause, ~30% of direct deaths)
2. Hypertensive disorders — pre-eclampsia and eclampsia (~20%)
3. Sepsis (~10–15%)
4. Obstructed labour and its complications (~8%)
5. Unsafe abortion (~8%)
6. Other direct causes (embolism, anaesthetic complications)
Indirect causes — anaemia (a major contributor in India, often as an aggravating factor to haemorrhage), cardiac disease, tuberculosis, diabetes, and malaria — together account for a significant and growing proportion of maternal deaths, particularly as direct causes are progressively controlled.
For perinatal mortality, the principal determinants are: prematurity and low birthweight (the single largest category), birth asphyxia (closely linked to quality of intrapartum care), infections (sepsis, congenital syphilis, TORCH), and congenital malformations. The perinatal mortality audit is the systematic process by which facilities review all perinatal deaths to classify them, identify modifiable factors, and implement corrective actions. Audit cycles follow a structured format: case notification → case notes review → classification of cause of death and contributing factors (using frameworks such as the Wigglesworth or CODAC classification) → identification of modifiable factors → implementation of change → audit of next cycle's rates.
The Maternal Death Review (MDR) programme in India mandates notification of all maternal deaths within 24 hours, a facility-level review using a standard proforma within 48 hours, and case escalation to district and state review committees. The review identifies the three delays that applied, the primary and contributing medical causes, and system-level recommendations. This information feeds directly into district health planning.
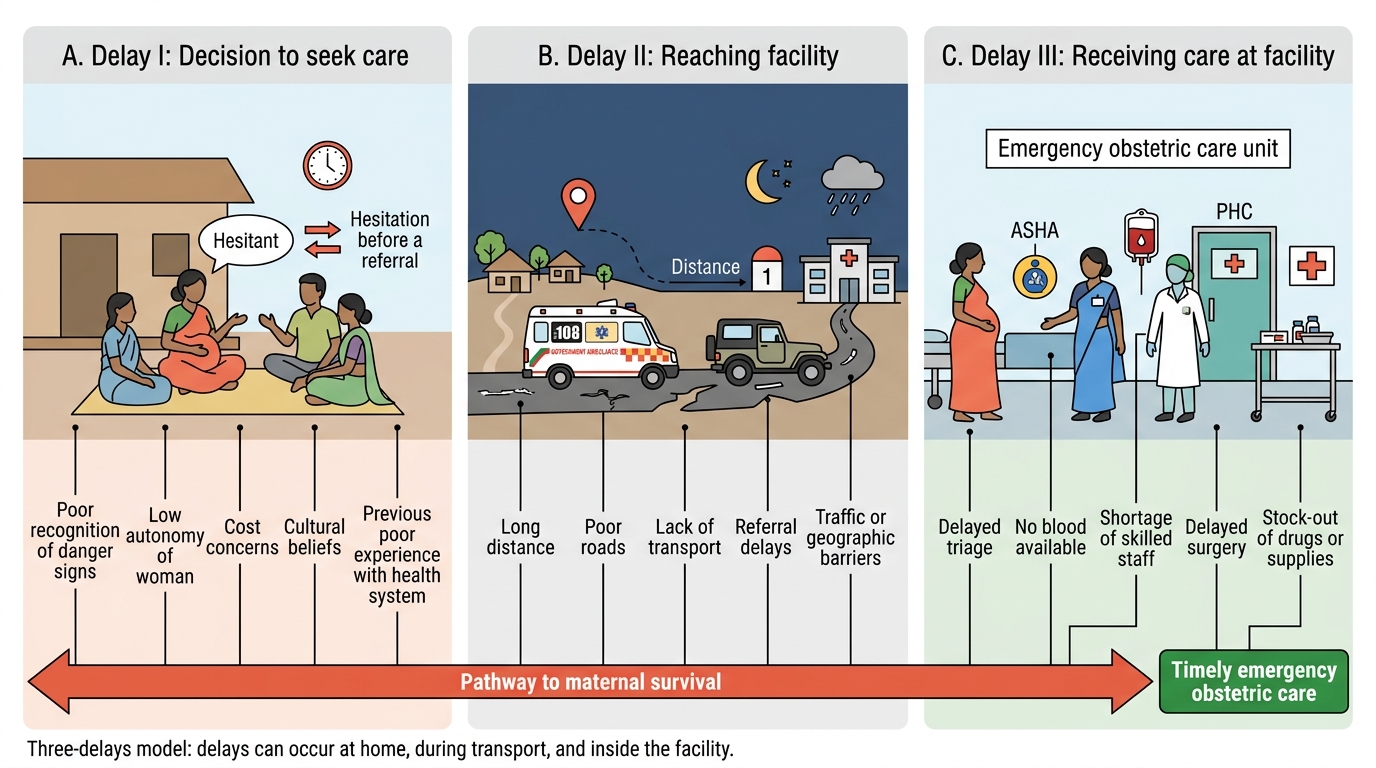
Three-Delays Model in Maternal Care
SELF-CHECK
Which of the following is the MOST common direct cause of maternal death in India?
A. Sepsis following caesarean section
B. Unsafe abortion
C. Postpartum haemorrhage
D. Eclampsia
Reveal Answer
Answer: C. Postpartum haemorrhage
Postpartum haemorrhage (PPH) is the single leading direct cause of maternal death globally and in India, accounting for approximately 30% of direct maternal deaths. Eclampsia and hypertensive disorders account for approximately 20%, and sepsis for approximately 10–15%. Unsafe abortion contributes approximately 8%.
Clinical and Applied Significance of Vital Statistics
Vital statistics are not merely academic indices — they are the operational currency of obstetric quality improvement and health system accountability. Each indicator has a defined pathway from data collection to action.
The Maternal Death Review (MDR) pathway: notification (facility notifies CMO within 24 hours) → facility review (48-hour turnaround) → district review committee → state level review → national-level synthesis and policy feedback. The MDR proforma captures: demographic data, antenatal care history, place of death, clinical summary, cause of death (primary + contributing + underlying), three-delays analysis, and recommendations. Quarterly review of MDR data identifies district-specific bottlenecks — e.g., if 80% of maternal deaths involve Delay III at a specific sub-district hospital, the recommendation is targeted skill-building and drug supply reinforcement.
The Perinatal audit cycle mirrors MDR in structure: notification → case review → cause classification → modifiable factor identification → corrective action → re-audit. Perinatal audit has demonstrated impact in reducing birth asphyxia deaths through improved partograph use, oxytocin protocols, and timely surgical intervention. The goal is not to assign blame but to identify modifiable factors — system, provider, patient-side — where targeted intervention can prevent future deaths.
The Robson Ten-Group Classification System (TGCS) for caesarean section audit (covered in OG1.4) complements perinatal audit by examining mode of delivery as a contributor to perinatal outcomes.
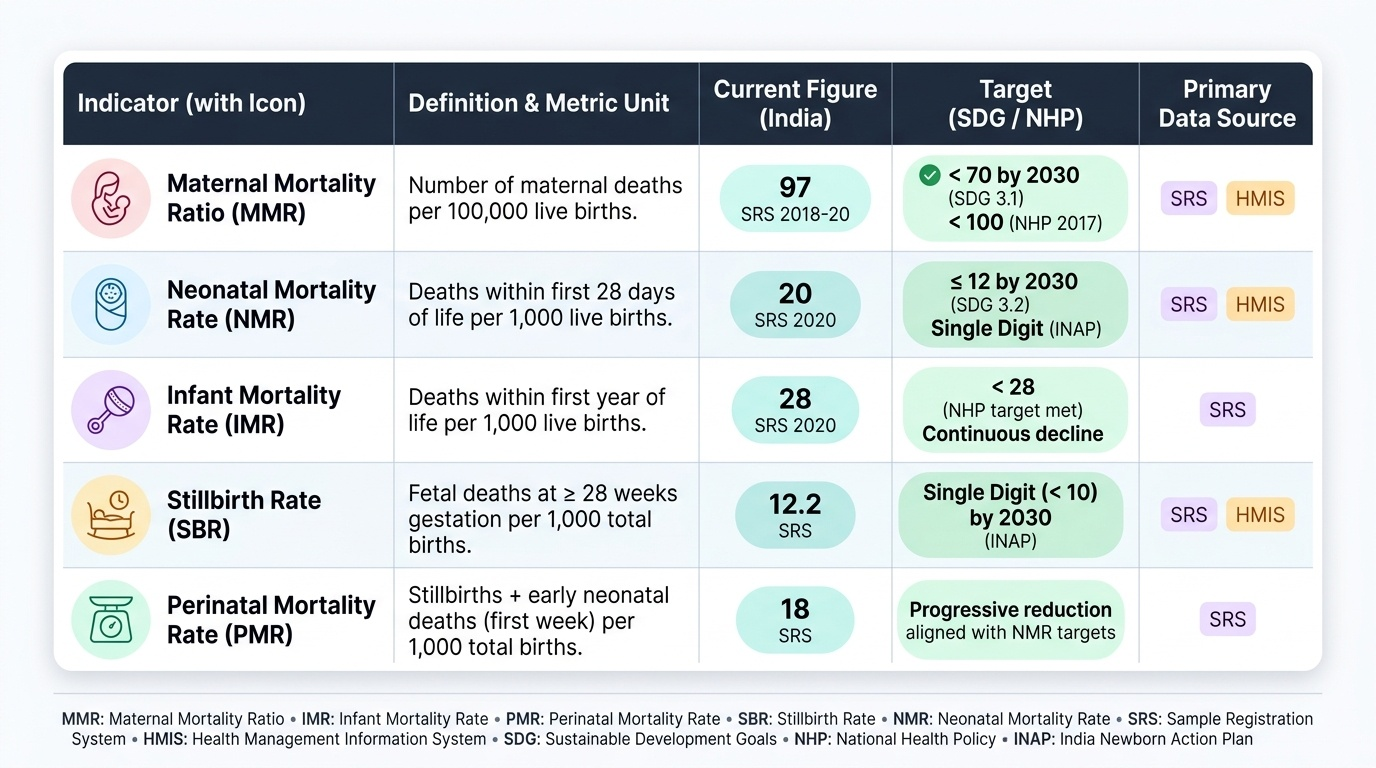
At the national level, the SDG 3.1 target is an MMR below 70 per 100,000 live births by 2030. India's National Health Policy 2017 set an intermediate target of MMR ≤100 by 2020 (achieved). The SDG 3.2 target is end preventable deaths of newborns and children under 5 — operationalised as NMR ≤12 per 1,000 live births by 2030. Progress is tracked through SRS and HMIS data, with annual state-level reports.
Provided image
For the individual clinician, the practical implications are: (1) know the definitions precisely enough to correctly classify deaths encountered in practice; (2) participate actively in facility-level MDR and perinatal audit processes; (3) understand that improving these statistics depends on both clinical skill (e.g., active management of third stage to prevent PPH) and system-level change (e.g., ensuring blood bank availability, 24-hour EmOC services). The obstetric vital statistics framework thus connects the 2 AM death in a district hospital to a global sustainability agenda — and to every clinical decision made in the labour ward.